
- USD/JPY closed August above the Kijun-Sen and the Ichimoku cloud, showing the strength of buyers; a break above 152.00 is needed to target the yearly high of 161.95.
- The pair is consolidating within the range of 140.78-147.30 within the Ichimoku cloud, indicating potential for sideways trading. A break above 149.39 is required for the continuation of the uptrend; a drop to 141.69 could test the Kumo bottom at 140.78.
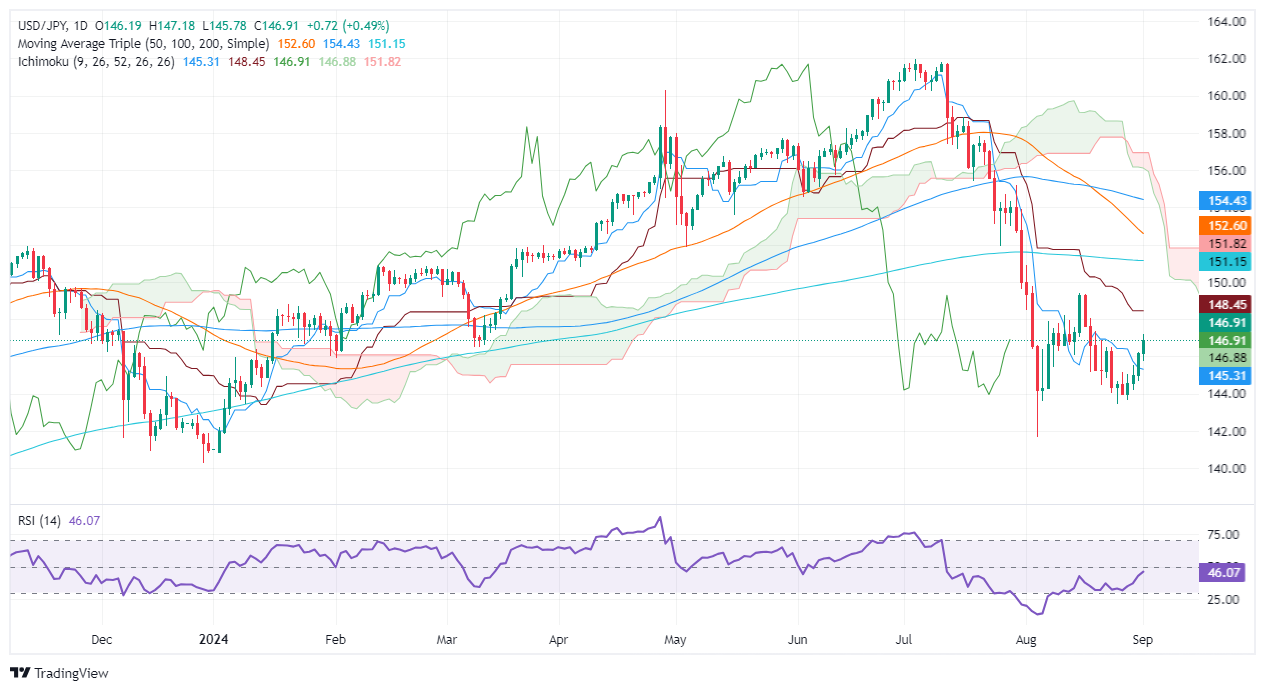
- Buyer momentum is picking up, targeting the Kijun-Sen at 148.46. Watch for resistance at 147.00 and 148.00; a drop below the Senkou Span A at 146.90 can lead to levels of 146.00 and Tenkan-Sen at 145.31, approaching the support at 145.00.
USD/JPY is up for a fourth consecutive day on Monday as September begins, gaining 0.49% amid low liquidity conditions during the North American session. At the time of writing, the pair is trading at 146.87 after bouncing off a daily low of 145.78.
USD/JPY Price Forecast: Technical Outlook
The monthly chart of USD/JPY shows that the pair fell towards 141.69 but recovered in the end and closed at 146.17, above the Kijun-Sen and the Ichimoku (Kumo) cloud. Although this suggests that buyers are in charge, the pair needs to break above 152.00 to retest the yearly high of 161.95.
From a weekly perspective, USD/JPY is consolidating around the top of the 140.78-147.30 range within the Kumo, an indication of sideways trading. For buyers to resume the uptrend, they need to push prices above the latest cycle high of 149.39. On the other hand, sellers need to break above 141.69 before testing the bottom of the Kumo at 140.78.
Meanwhile, the USD/JPY daily chart shows that buyers are regaining control. They could push prices towards the Kijun-Sen at 148.46, but they need to overcome key resistance levels first. The first would be the 147.00 figure, followed by the 148.00 threshold.
Conversely, if sellers step in and drag the price below the Senkou Span A at 146.90, that may pave the way for further declines. The next support would be the 146.00 mark, followed by the Tenkan-Sen at 145.31, before challenging 145.00.
USD/JPY Price Action – Daily Chart
Japanese Yen PRICE Today
The table below shows the Japanese Yen (JPY) exchange rate against major currencies today. The Japanese Yen was the strongest currency against the US Dollar.
| USD | EUR | GBP | JPY | CAD | AUD | NZD | CHF | |
|---|---|---|---|---|---|---|---|---|
| USD | 0.00% | 0.00% | -0.03% | -0.02% | -0.02% | 0.18% | 0.00% | |
| EUR | 0.00% | -0.01% | -0.02% | -0.03% | -0.03% | 0.08% | 0.00% | |
| GBP | -0.01% | 0.00% | 0.00% | -0.02% | -0.02% | 0.09% | 0.00% | |
| JPY | 0.03% | 0.02% | 0.00% | -0.01% | -0.00% | 0.00% | 0.00% | |
| CAD | 0.02% | 0.03% | 0.02% | 0.01% | -0.02% | 0.01% | 0.03% | |
| AUD | 0.02% | 0.03% | 0.02% | 0.00% | 0.02% | -0.01% | 0.03% | |
| NZD | -0.18% | -0.08% | -0.09% | -0.01% | -0.01% | 0.00% | 0.03% | |
| CHF | -0.00% | 0.00% | -0.01% | -0.01% | -0.03% | -0.03% | -0.03% |
The heatmap shows percentage changes of major currencies. The base currency is selected from the left column, while the quote currency is selected from the top row. For example, if you choose the Japanese Yen from the left column and move along the horizontal line to the US Dollar, the percentage change shown in the chart will represent the JPY (base)/USD (quote).
Source: Fx Street
I am Joshua Winder, a senior-level journalist and editor at World Stock Market. I specialize in covering news related to the stock market and economic trends. With more than 8 years of experience in this field, I have become an expert in financial reporting.


