
- USD/MXN is trading at 17.1200, down 0.53%, after the US CPI for August slightly exceeded the 3.6% forecast.
- CME’s FedWatch tool indicates a 41% probability of a 25 basis point rate hike in November, keeping traders cautious.
- Upcoming US labor and retail data and Banxico’s 11.25% TIIE could push USD/MXN to test the 17.0000 level.
He Mexican peso (MXN) reduces its losses and recovers ground against the US dollar (USD), after data from the United States (US) further cemented the possibility of the US Federal Reserve raising rates at the September meeting. The USD/MXN pair is trading at 17.1200, down 0.53%, after reaching a daily high of 17.2919.
The Mexican Peso rebounds against the Dollar amid uncertainty about US monetary policy.
US inflation exceeded estimates, as the August Consumer Price Index (CPI) stood at 3.7% year-on-year, while forecasts placed inflation at 3.6%, above July data. On the contrary, core inflation fell from 4.7% year-on-year in July to 4.3% expected by analysts, which paints a mixed inflation picture. However, the data has not reflected additional tightening by the US Federal Reserve (Fed), as shown by money market futures data.
CME’s FedWatch tool still sees the Fed keeping rates around the 5.25%-5.50% range for the next meeting in September, but for November, the odds of a 25 basis point rate hike are in 41%.
However, Dollar bears are not out of the woods yet, as labor market data continues to show signs of a hot labor market. Jobless claims for the latest week are expected to rise to 225,000, up from 216,000 the previous week. This, along with the August retail sales report, which is expected to be weaker than the July numbers, could cement the end of the Fed’s tightening cycle.
More inflation data will be released on Thursday, and the Producer Price Index (PPI) is expected to continue to slow.
If the data shows signs of an economic slowdown in the US, expect the USD/MXN to test the 17.0000 figure, as the difference in interest rates between Mexico and the US favors the former, with Banxico’s TIIE at 11.25%, compared to the effective Federal Funds Rate (FFR) at 5.33%.
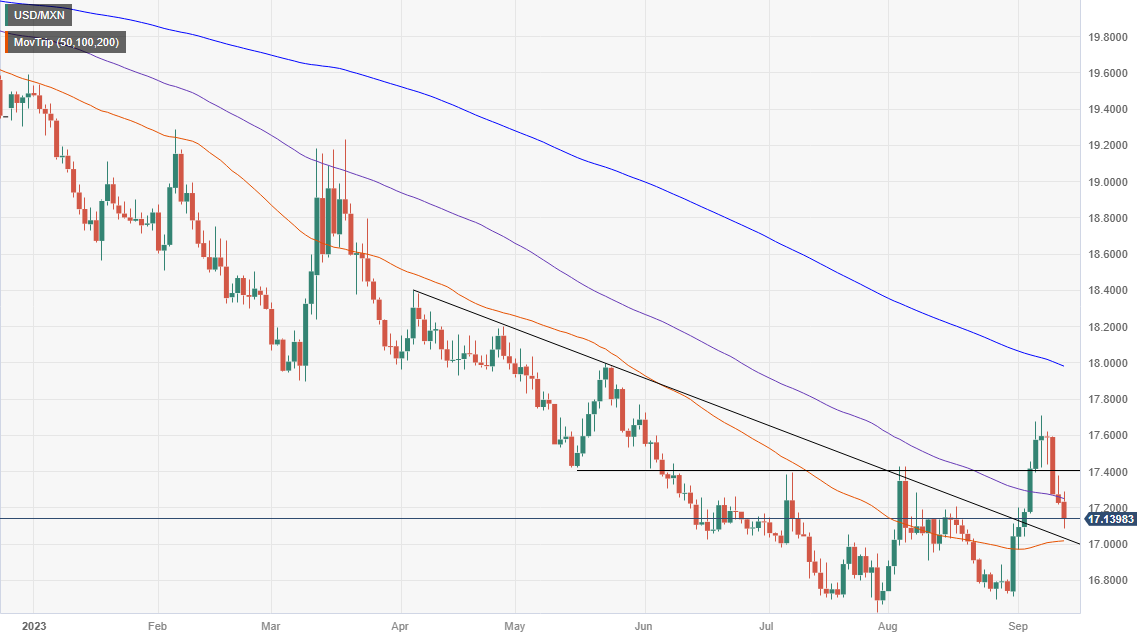
USD/MXN Price Analysis: Technical Outlook
Although USD/MXN has retreated a bit, the pair maintains a neutral upside bias unless Mexican Peso buyers reclaim the August 28 daily low of 16.6924. However, it could challenge the psychological figure of 17.00, but traders must break the solid support that stands in its way. Before testing, the 20-day moving average (DMA) is at 17.0902, followed by the 50-DMA at 17.0108. On the contrary, a bullish continuation would resume once buyers reclaim the 100-DMA at 17.2452.
Source: Fx Street
I am Joshua Winder, a senior-level journalist and editor at World Stock Market. I specialize in covering news related to the stock market and economic trends. With more than 8 years of experience in this field, I have become an expert in financial reporting.


