
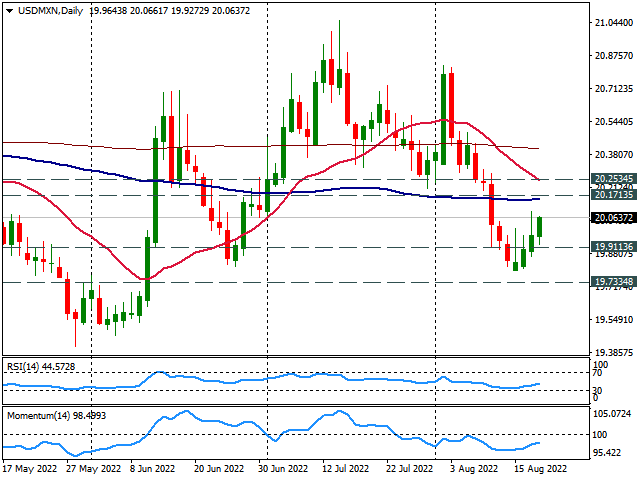
- USD/MXN rises for the third consecutive day, again above 20.00.
- Dollar needs to stay above 20.00, next resistance at 20.15/20.
- If it drops below 19.90 the bullish bias is removed.
The USD/MXN rises for the third consecutive day, although so far it has failed to print new weekly highs. Upside remains capped below 20.10. The next critical resistance zone is seen around 20.15/20, a zone that contains horizontal resistances and also the 100 SMA.
A firm break above 20.25 would open the door for more gains with a target of 20.50.
In the very short term, the bias is bullish, with technical indicators between flat and bullish. The momentum is not strong enough and seems to be fading. The bias will weaken on a decline below 20.00. While a daily close above 20.00 would be a positive sign for the bulls.
A key support emerges at 19.90 which if not held, USD/MXN could drop further to retest the 19.80 zone.
USD/MXN daily chart
Technical levels
Source: Fx Street
With 6 years of experience, I bring to the table captivating and informative writing in the world news category. My expertise covers a range of industries, including tourism, technology, forex and stocks. From brief social media posts to in-depth articles, I am dedicated to creating compelling content for various platforms.


