
- The USD/MXN pair loses close to 2%, caused by the SVB crisis.
- It reached a weekly high of $19.1789, a level not seen since February.
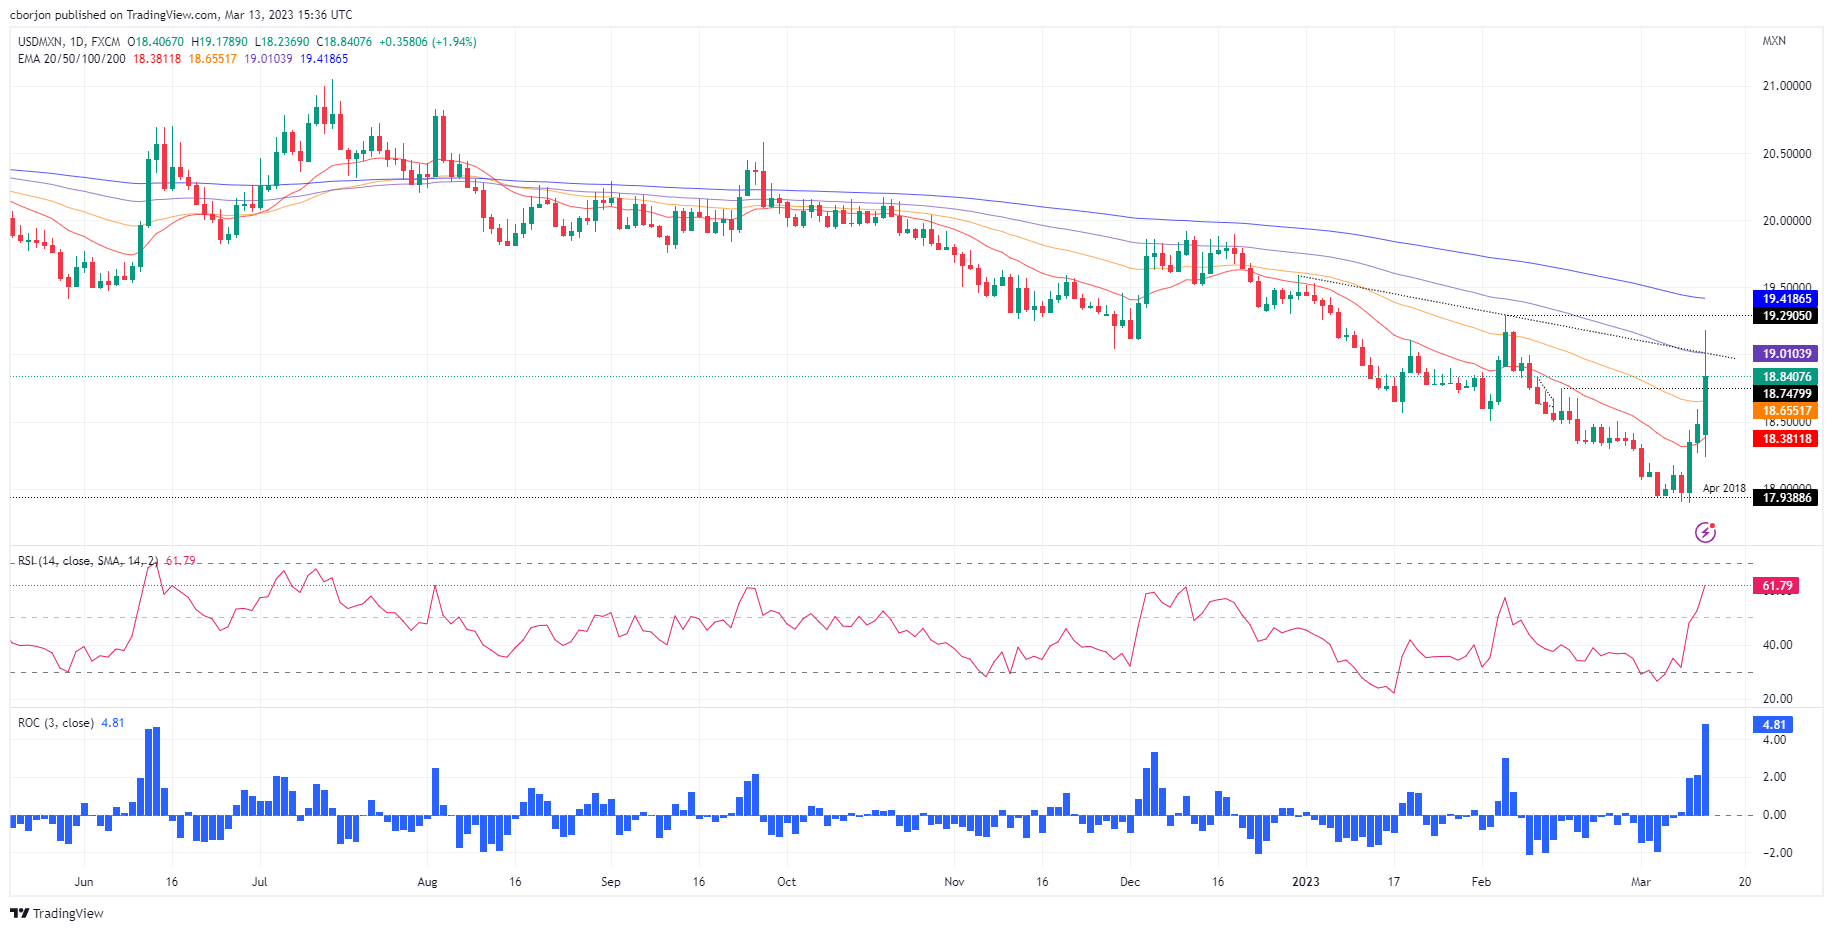
- USD/MXN Price Analysis: A close for the week above $19.00 could lead to a move towards $19.50.
The Mexican peso (MXN) it is the worst performer against the US dollar (USD) due to fears of possible contagion after the bankruptcy of Silicon Valley Bank (SVB). Over the weekend, the State seized the Signature Bank of New York amid the need to stabilize the financial system. At the time of writing, the USD/MXN is trading at 18.8246, gaining 1.85% from its opening price.
The crisis of regional banks in the US weakens the Mexican peso
The internal crisis of the banking sector in the United States (USD) caused a change in the sentiment of the markets. The winner is the precious metals segment, with Gold breaking the $1,900 barrier. Wall Street turned positive, except for financials, which lose as US Treasury yields plummet. The interest rate expectations of the US Federal Reserve (Fed) stand for a rise of 25 basis points in March, with a variation of 64.2%, and no variation, with 35.8%. Traders speculate that the current crisis in the regional banking segment will prevent the Fed from tightening monetary conditions.
The 2-year US Treasury yield is down 50 basis points, the biggest drop since the 2008 global financial crisis (CFG), just above the 4% threshold. The yield on 10-year Treasury bonds stands at 3,466%, 23 basis points less.
CME’s FedWatch tool puts the FFR at between 4.75% and 5.00%, with traders expecting rate cuts in June, September and December.
Consequently, the USD/MXN appreciates in uncertain scenarios. Large traders, fearful of a crisis, move their assets out of emerging markets and back into the Dollar or Gold.
Let’s remember that Jerome Powell, the chairman of the Federal Reserve, testified before the finance committee of the Senate and the House of Representatives. Powell said that interest rates could rise to higher levels than anticipated. He added that the rate hike could be faster, depending on economic data.
Given this scenario, the USD/MXN broke important technical ceilings, such as the 50 and 100-day moving average, at 18.6546 and 19.010, respectively. However, it has fallen below $19.00, having that barrier as the first top.
USD/MXN Technical Analysis
From a technical point of view, the USD/MXN could consolidate between the 50 and 100-day SMA, at 18.6549 and 19.00, respectively. The current trend is neutral. However, a break above $19.00 would open the way to the February 6 high at $19.2905. On a break of this zone, the USD/MXN pair could reach the 200-day moving average (MM) at 19.4187.
Momentum indicators such as the Relative Strength Index (RSI) have turned bullish above 50, while the Exchange Rate (Rate) shows increased demand for dollars.
On the other hand, a drop below the 50-day MA at 18.6555 could trigger a pullback towards the 20-day MA at 18.3821 before testing the $18.00 barrier.
Source: Fx Street
I am Joshua Winder, a senior-level journalist and editor at World Stock Market. I specialize in covering news related to the stock market and economic trends. With more than 8 years of experience in this field, I have become an expert in financial reporting.


