
- The USD/MXN pair is trading at 17.1222, up 0.56%, recovering from a daily low of 16.9699.
- US Nonfarm Payrolls for August met expectations, but the rising unemployment rate led to an initial drop in USD/MXN.
- The ISM Manufacturing PMI shows signs of improvement, helping the USD recovery.
He US dollar (USD) regained some ground against Mexican Peso (MXN), which had gained ground earlier in the session, and fell to a daily low of 16.9699. Still, recent economic data from the United States (US) and strong US yields weighed on the emerging market currency, which pared its gains to 12.09% on the year. The USD/MXN is trading at 17.1222, with an advance of 0.56%.
MXN trims its yearly gains as US bond yields and US economic data weigh on the emerging markets currency
Before the Wall Street open, the US Department of Labor revealed that the US economy added 187,000 jobs to the economy, the same number as in July, which could have been positive for the Dollar, but not it was. The unemployment rate rose 0.3%, from 3.5% to 3.8%, approaching the Federal Reserve’s (Fed) target of 4.1% through 2023.
Initially, USD/MXN fell like a stone from daily highs around 17.2000, below 17.0000, as investors weighed in that Jerome Powell and company would not further tighten monetary policy. However, traders took profits waiting for other data that will affect the markets.
Following the jobs report, the August ISM Manufacturing PMI showed signs of improvement, rising to 47.6 from 46.4 in July, although it remained in contractionary territory. Most subcomponents were up, except for new orders, which remained depressed, but factory inventories, which remain low, could spur higher orders in the near term.
The markets reacted in the opposite way, after the business activity report, despite the fact that the traders ruled out additional rate hikes by the Fed, and as of today, they expect the first rate cut by May 2024, as shows CME’s FedWatch tool. The USD/MXN pair reversed course and rose towards 17.1500, but failed to gain traction to push exchange rates to fresh weekly highs above 17.2012.
On the Mexican front, the Bank of Mexico (Banxico) decided to cut its hedging program and reported more than 5.65 billion dollars in remittances in July, approaching the monthly record of 5.7 billion dollars reached last May. Report that the Global Manufacturing PMI for August was at 51.2 against 53.2 in July, showing a slight weakness in the sector.
USD/MXN Price Analysis: Technical Perspective
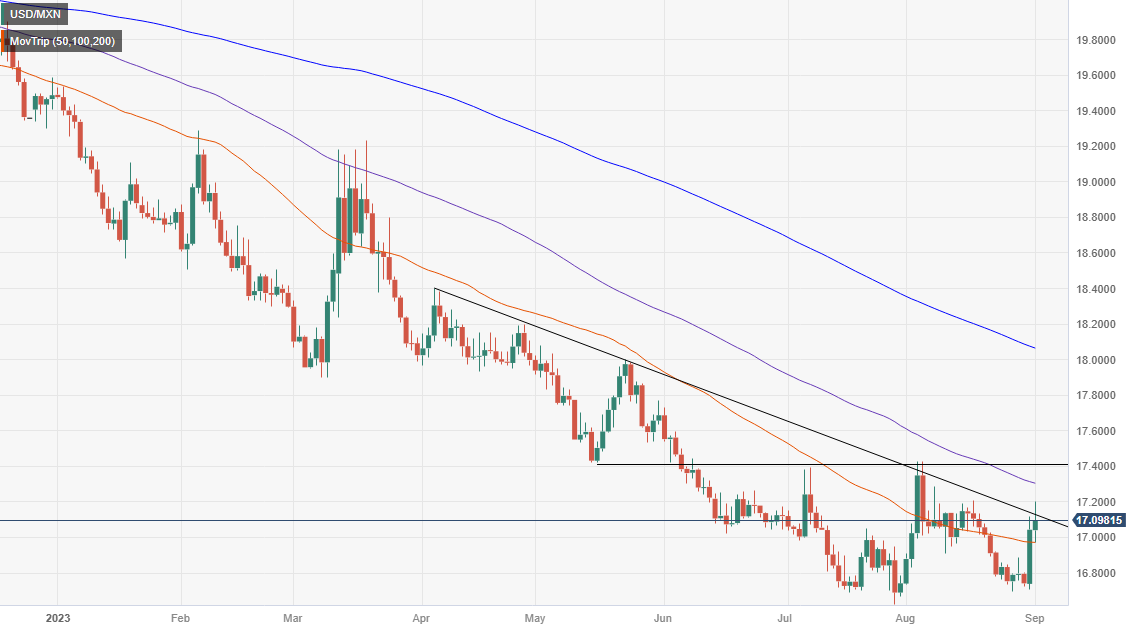
From a technical standpoint, the USD/MXN has broken out and is about to post its most significant weekly gain of over 2.40%. Buyers are watching for a break of a descending resistance trend line drawn from the April 2023 highs at 18.4010, which, once broken, could set the May 17 swing low at 17.4038 as crucial resistance. A break of the latter would put on the table a challenge to 18,0000.
Source: Fx Street
I am Joshua Winder, a senior-level journalist and editor at World Stock Market. I specialize in covering news related to the stock market and economic trends. With more than 8 years of experience in this field, I have become an expert in financial reporting.


