
- With Norges Bank keeping interest rates at 4.5% and suggesting a prolonged duration of tight monetary policies, an upward trend for the Norwegian Krone is likely.
- The prudent statements of the Federal Reserve have supported the Dollar in recent times.
- This week's US retail sales and CPI data will pace the pair.
The USD/NOK pair saw a sharp decline in the session on Monday, driven mainly by cautious sentiment from Norges Bank and a somewhat weak start to the week for the Dollar.
The Federal Reserve (Fed) made cautious comments that boosted the Dollar last week. For now, the chance of a rate cut in June has fallen to 5%, down from 10% at the beginning of last week, while the odds for July have fallen to around 25%, down from 40%, and a tightening In November it is still completely discounted. Those odds will vary, however, as the Fed has clearly stated that it remains dependent on the data, and this week's April Consumer Price Index (CPI) data, as well as retail sales, will be closely watched by the investors.
On the Norwegian krone side, Norway's central bank, Norges Bank, maintained its hawkish stance, keeping the interest rate at 4.5% and hinting at a prolonged duration of tight monetary policy. This inclination, together with the Consumer Price Index (CPI) for April, which showed a slight increase to an annual rate of 3.6% and an unexpected jump in the core inflation rate to 4.4%, has led to a bullish outlook. for the Norwegian krone. Market participants only expect a 50 basis point cut over the next 12 months.
USD/NOK technical analysis
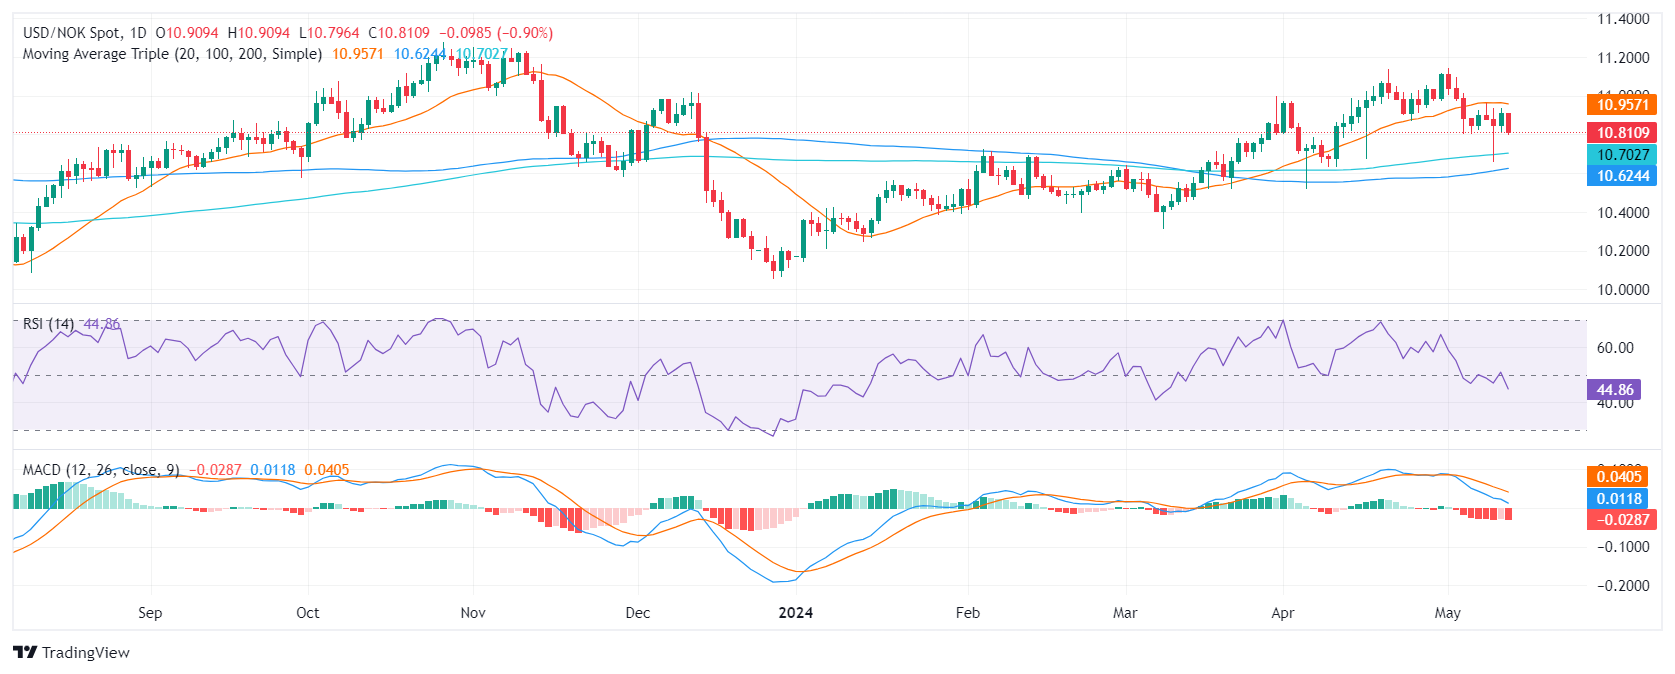
On the daily chart, the Relative Strength Index (RSI) of the USD/NOK pair is in negative territory, indicating modest bearish momentum. Despite the RSI swinging within the negative and positive zones in recent sessions, the latest reading reveals a clearer bearish trend, suggesting that sellers could slightly rule the market at the moment. The moving average convergence divergence (MACD) histogram, showing ascending red bars, further supports this claim. These red bars on the MACD indicate that negative momentum is increasing and bearish sentiment is taking hold.
Source: Fx Street
I am Joshua Winder, a senior-level journalist and editor at World Stock Market. I specialize in covering news related to the stock market and economic trends. With more than 8 years of experience in this field, I have become an expert in financial reporting.


 meeting for peace: “First step towards reconciliation”")
