
- The USD/NOK pair recorded a slight rebound in the session on Monday, settling at 10,693, with buyers taking measured steps.
- With the Fed showing resistance against premature easing, the USD finds solid support.
- Markets will look for further clues on the Fed's stance in Wednesday's FOMC Minutes.
The USD/NOK pair is trading with slight gains, and the Dollar remains firm against its peers. The Federal Reserve (Fed) continues to send cautious messages about future policy decisions, so traders await the publication of the minutes of the Federal Open Market Committee (FOMC), scheduled for Wednesday, to obtain more information on the stance of the entity.
The Fed's unified voice warning about easing, despite the softening of recent data, remains one of the pair's influential factors that is limiting the pair's decline. The views align with market bets of a 10% chance of a rate cut in June rising to 30% and 80% in July and September according to CME's FedWatch tool.
In terms of data, the economic calendar remained empty on Monday, and the week's data highlights include the FOMC minutes from the May meeting on Wednesday, S&P Global PMI readings for May on Thursday, and the of April durable goods on Friday.
USD/NOK technical analysis
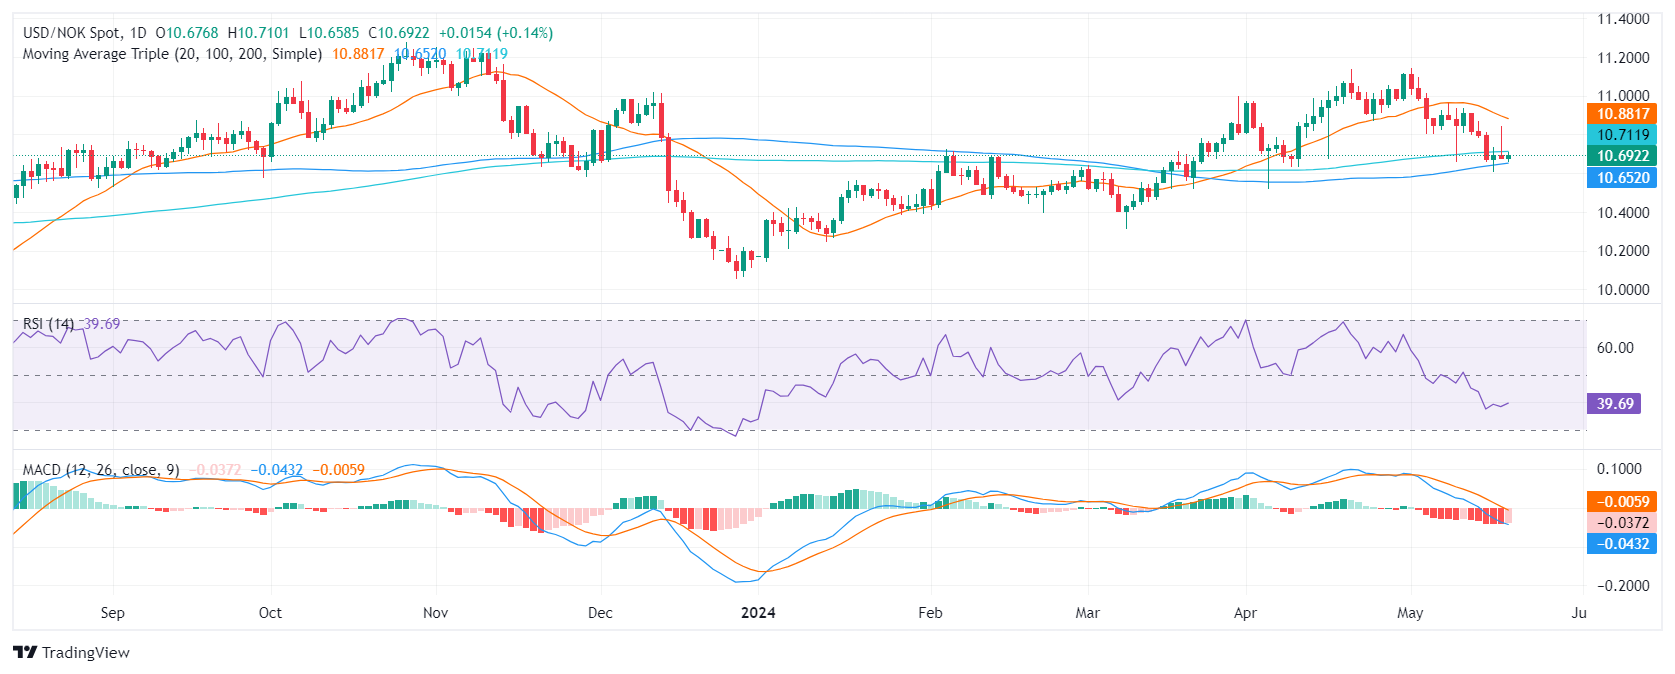
On the daily chart, the RSI is in negative territory, with a slight increase to 43, indicating a slow recovery of the negative trend. At the same time, the moving average convergence divergence (MACD) reveals a flat trend with persistent red bars, suggesting that negative momentum continues to prevail among investors.
USD/NOK Daily Chart
From a broader perspective, USD/NOK is at a critical juncture, positioned below the 20-day and 200-day SMA, suggesting a negative outlook. Still, losses will be limited if the pair stays above the 100-day moving average at 10,652.
Source: Fx Street
I am Joshua Winder, a senior-level journalist and editor at World Stock Market. I specialize in covering news related to the stock market and economic trends. With more than 8 years of experience in this field, I have become an expert in financial reporting.


