
- USD/ZAR fell towards 18,933, near the 20-day SMA.
- South Africa reports inflation figures for August and retail sales for July on Wednesday.
- The Federal Reserve (Fed) is expected to pause but leave the door open for further increases.
In Tuesday’s session, the USD/ZAR faced some selling pressure and dropped to 18.933, losing 0.25%, and appears to be on track to retest the 20-day SMA at 18.880.
All eyes are on Wednesday. South Africa reports the Consumer Price Index (CPI) for August, with the headline figure expected to rise slightly to 4.8% year-on-year, while the core inflation rate is expected to remain stable at 4.7% year-on-year. Retail sales for July are expected to be -1.0% year-on-year, compared to a decline of 0.9% year-on-year in June. Looking ahead to Thursday’s South African Reserve Bank meeting, the decision is likely to be to keep interest rates at 8.25%, despite some earlier expectations of a hike. At the moment, for the next twelve years, the markets do not foresee any increase and discount that the bank will maintain rates at 8.25%.
On the Fed side, markets expect the bank to keep rates steady at 5.25-5.50%, but Chairman Powell is likely to strike a hawkish tone and signal future rate hikes that could benefit the dollar. The strong performance of the US economy, especially in the services sector, and a mixed labor market suggest that the Fed could leave room for a further hike to curb inflation risks.
USD/ZAR Levels to watch
The daily chart shows signs of bullish exhaustion for USD/ZAR. The Relative Strength Index (RSI) indicates a neutral stance above its midline, showing a flat slope in positive territory, while the Moving Average Convergence (MACD) presents neutral red bars. In a broader picture, the pair is above the 20,100,200-day SMA, suggesting that the bears are struggling to challenge the overall uptrend.
Support Levels: 18,880 (20-day SMA), 18,728 (100-day SMA). 18,500.
Resistance levels: 19,000, 19,050, 19,150.
USD/ZAR Daily Chart
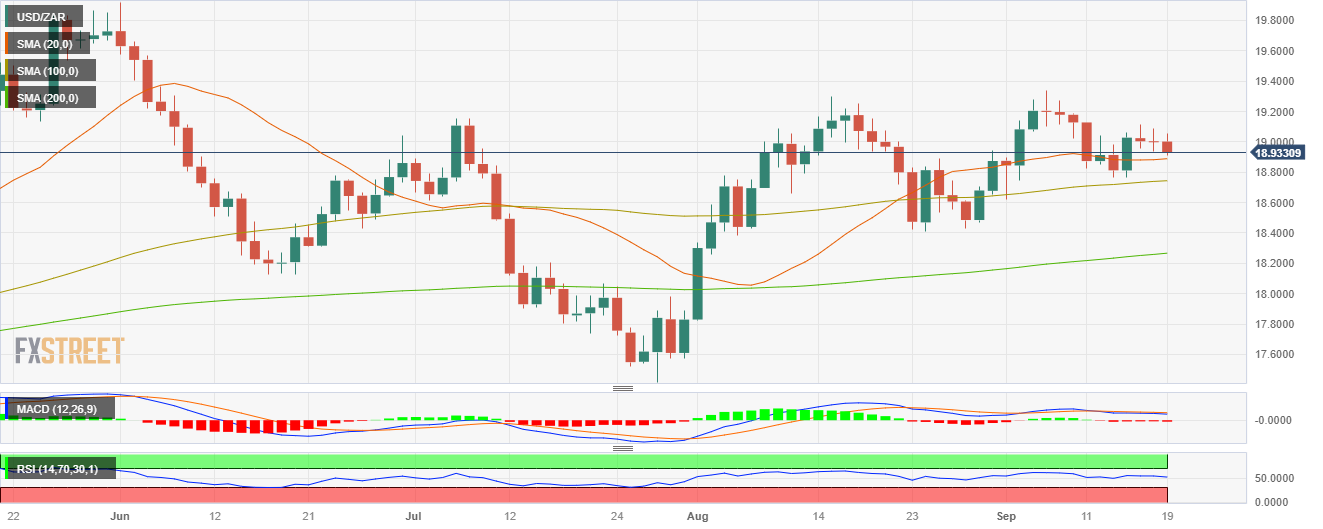
Source: Fx Street
I am Joshua Winder, a senior-level journalist and editor at World Stock Market. I specialize in covering news related to the stock market and economic trends. With more than 8 years of experience in this field, I have become an expert in financial reporting.


