
- USDJPY breaks three days of losses and tests the bottom of the one-month uptrend line.
- Sentiment remains bearish as uncertainty around the US mid-term elections persists.
- USDJPY Price Analysis: Buyers’ Rebound to 146.70 Will Keep Bullish Bias Intact; otherwise, a drop to the 100 day EMA is anticipated.
The USDJPY trims part of its losses from Tuesday and bounces off the 50-day EMA as buyers try to recapture the 146.00 figure after three consecutive losing days. The US mid-term elections are likely to end with a split control between Republicans and Democrats in the US Congress, keeping risk appetite up. At the time of writing, USDJPY is trading at 146.10, up 0.25% from its opening price.
USDJPY Price Analysis: Technical Outlook
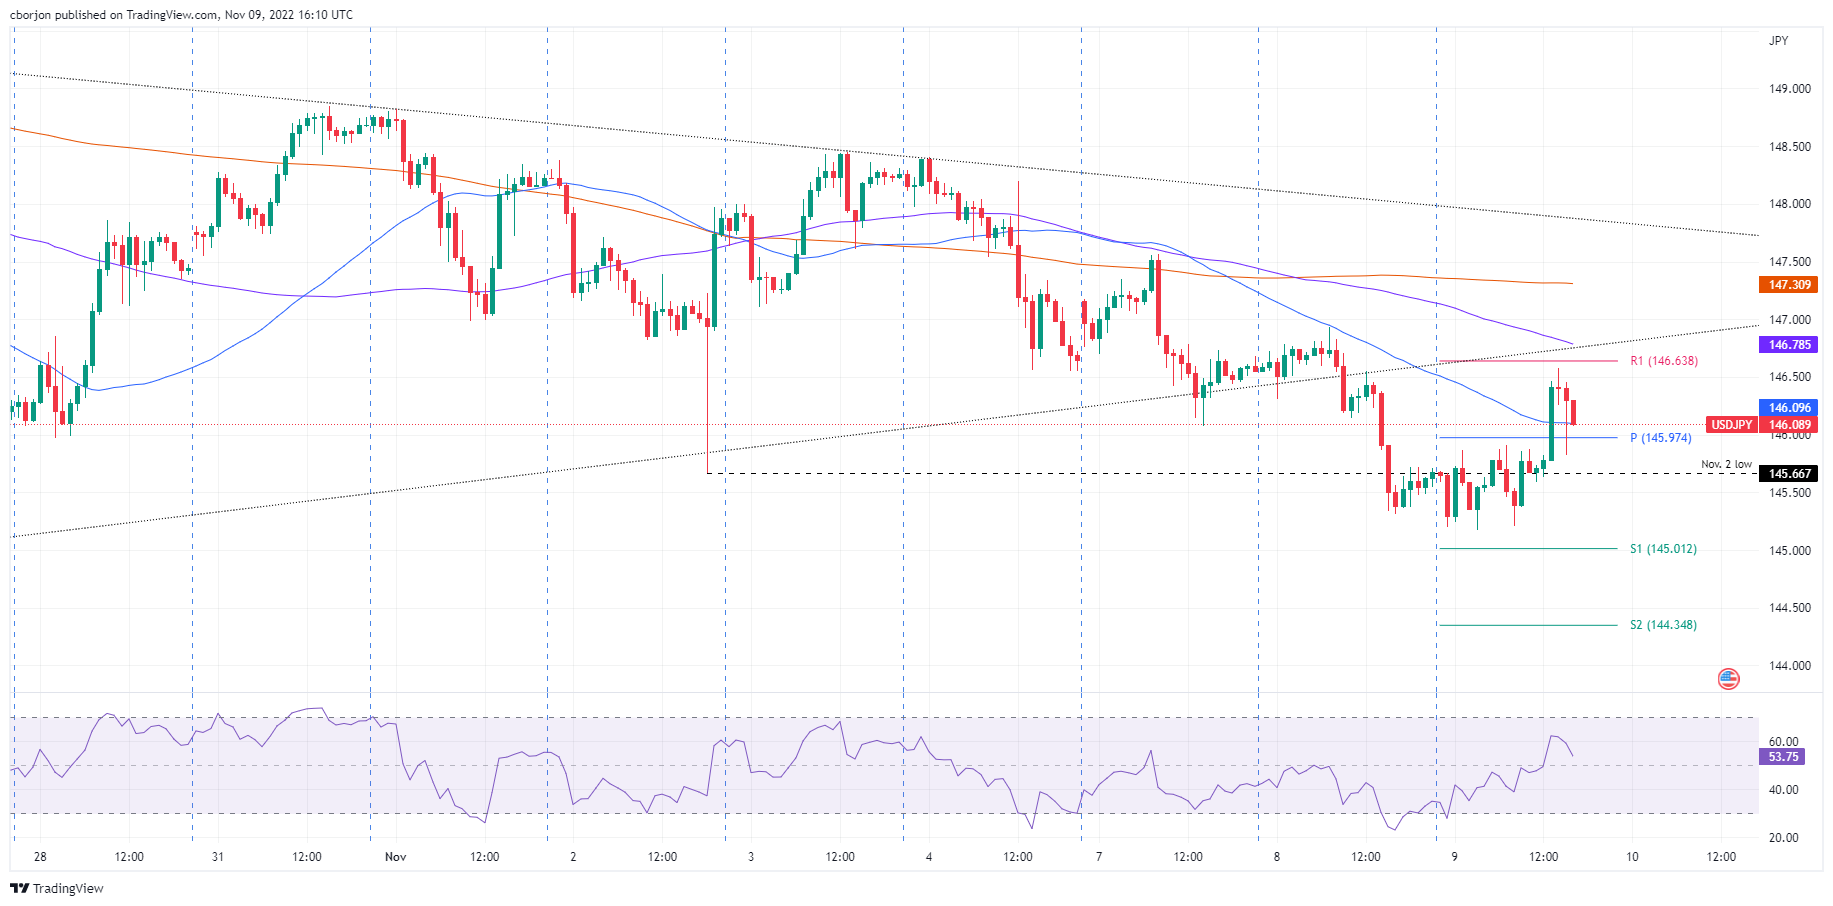
After dipping below a supportive uptrend line a month ago, USDJPY is close to breaking above it again, suggesting that buyers are gaining momentum. Notably, the Relative Strength Index (RSI) is in bearish territory but sloping upwards, implying that USDJPY would continue to rise once it clears.
In the short term, the hourly chart of USDJPY seems to be forming a base around the 145.00 figure, and on their way to the recovery of 146.00, the buyers surpassed the daily pivot point at 145.97 and tested the daily pivots at 146.63 R1. However, USD buyers did not have the strength to break through the latter, and USDJPY prices fell back towards 146.20.
Key USDJPY resistance levels lie at the R1 daily pivot at 146.63, which, once breached, would open the door for a test of the 100hrs EMA at 146.78, before the psychological signal at 147.00. On the other hand, the first support of the USDJPY would be 146.00. A break of the latter would expose the daily pivot point at 145.97, followed by the daily low at 145.17.
USDJPY Key Technical Levels
Source: Fx Street
With 6 years of experience, I bring to the table captivating and informative writing in the world news category. My expertise covers a range of industries, including tourism, technology, forex and stocks. From brief social media posts to in-depth articles, I am dedicated to creating compelling content for various platforms.


