
- The Western Texas Intermediate falls almost 3% due to the possible risks of a financial crisis in the US.
- The weakness of the US dollar slowed down the price of WTI.
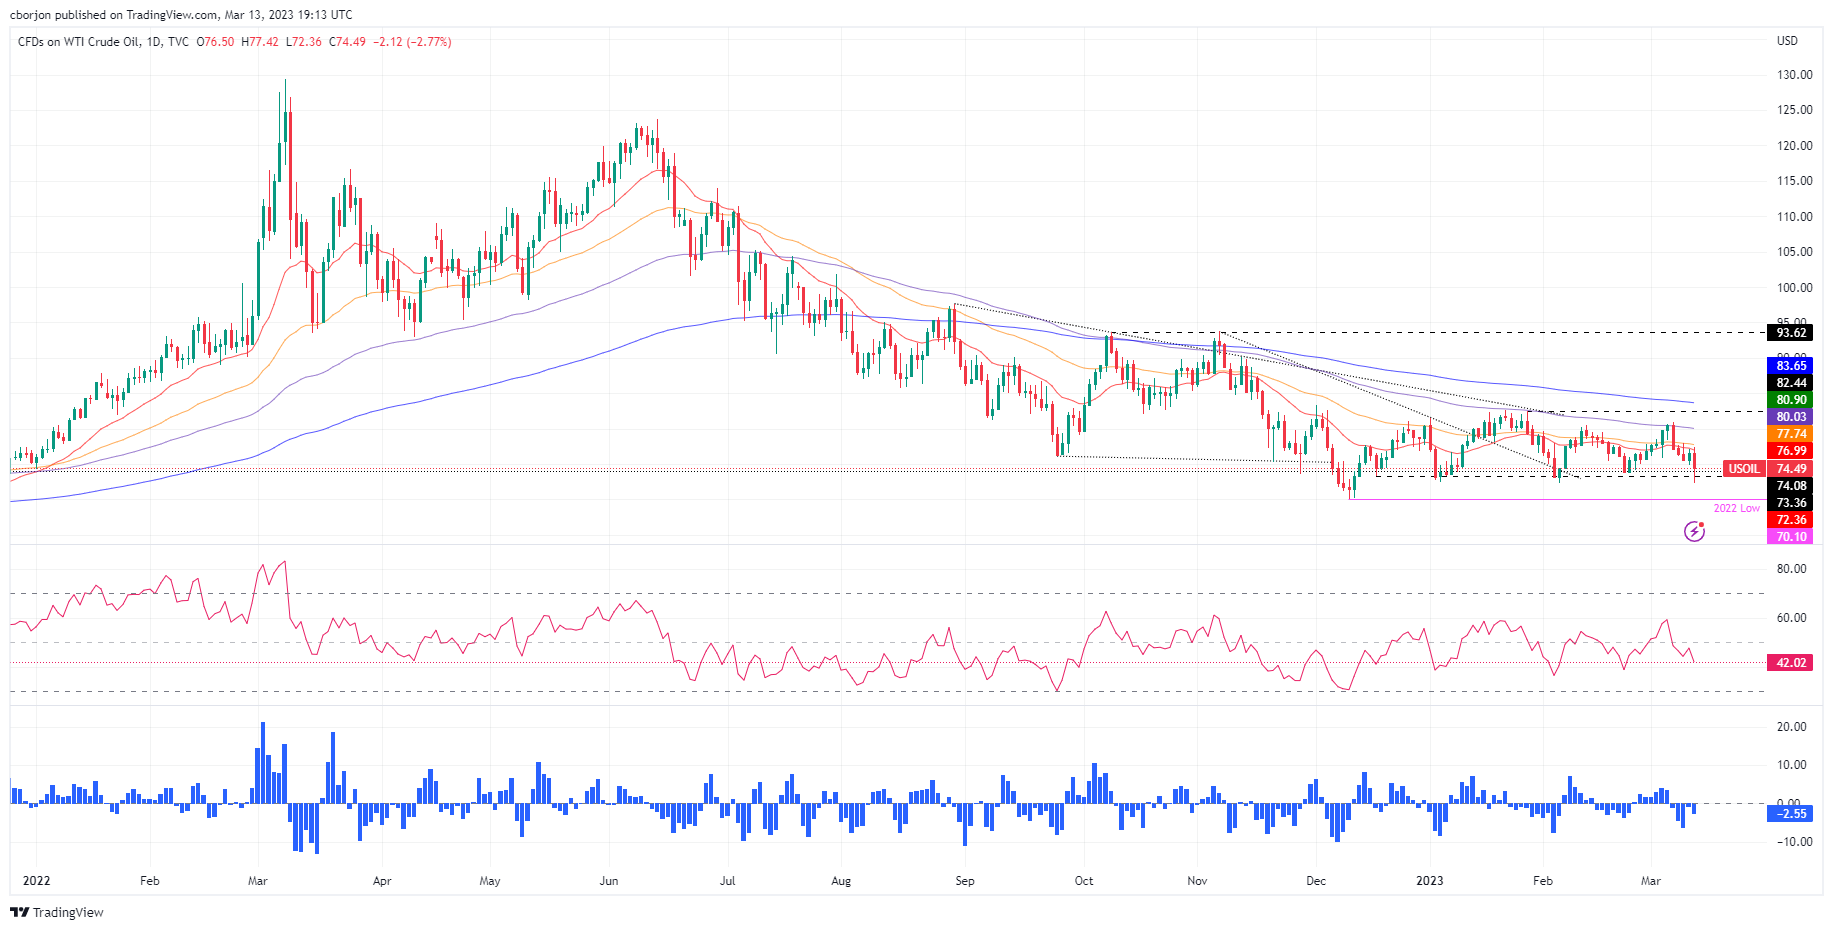
- WTI Price Analysis: May test March lows around $72.30.
The Western Texas Intermediate (WTI), The reference to US Crude Oil fell more than 2% due to risk appetite, since the banking crisis in the United States raises fears of a possible contagion. However, the recovery of Chinese demand halted the fall of WTI. At the time of writing these lines, WTI is trading at $74.54, having reached a high of $77.42.
US assets lost value last week on concerns about the impact of the Silicon Valley Bank failure, and regulators closed another bank in New York on Sunday.
US stocks were mostly higher on Monday, but volatile as investors wondered if the Fed would stop raising interest rates in March. The government took urgent measures on Sunday to boost confidence in banks. [.N]
The sudden shutdown of SVB Financial raised questions about how the Fed’s rapid rate hikes last year affected other banks. It also made investors think that the central bank might slow down its monetary policy.
Oil prices fluctuated on Monday as investors weighed how the news would affect the market. The price of WTI tends to rise with a weaker dollar because oil is more affordable for those who use other currencies.
High US oil reserves have also put pressure on crude prices, indicating weak demand.
Oil’s decline followed a positive day on Friday, when US jobs data came in better than expected. The number of jobs added in February was 311,000, well above the 205,000 forecast by market participants.
WTI Technical Analysis
As sentiment soured, benchmark US crude oil fell towards its daily low of $72.36. Buyers stepped in and dragged prices higher, but failed to recapture the 20-day EMA at $77.01. The WTI trend remains bearish, and it could touch the March lows again, but would need to break support areas. The first support would be $74.00. A break below would reveal the February 22 low of $73.83, followed by $73.00, and then year-over-year lows.
Source: Fx Street
I am Joshua Winder, a senior-level journalist and editor at World Stock Market. I specialize in covering news related to the stock market and economic trends. With more than 8 years of experience in this field, I have become an expert in financial reporting.


