
- US oil extends its gains to two consecutive days, although it faces solid resistance at the 50 EMA around $110.33.
- OPEC+ cut its 2022 market surplus to 1 million bpd, while political turmoil in Libya cut output by 600,000 bpd.
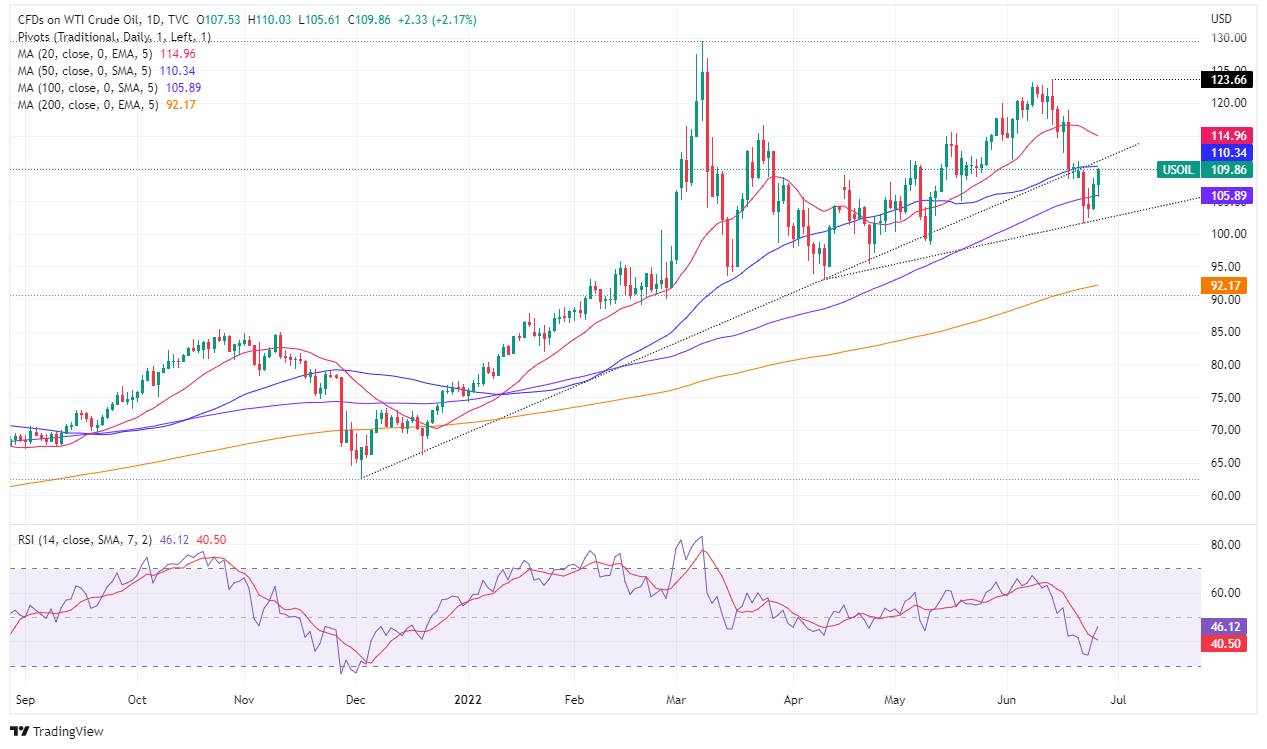
- WTI Price Analysis: Despite breaking an uptrend line, the price of oil has recovered losses and is now targeting $110.00.
The Western Texas Intermediate, also known as WTI, posted a solid bounce after testing the 100 EMA to the downside near $105.88 per barrel, near the daily low, and was reinforced late as OPEC+ cut surplus 2022 market from 1.4 million BPD to 1 million BPD, according to sources cited by Reuters. At the time of writing, WTI is trading at $109.86 per barrel.
Oil is rising due to various factors affecting the world economy. Over the weekend, the G7 is weighing capping Russian oil prices and looking for other ways to supply Russian oil and gas while Russia continues to fight Ukraine. Meanwhile, Libya’s state oil company said it may suspend exports from the Gulf of Sirte amid a worsening political crisis. Libya’s inability to resolve its political turmoil will reduce the oil market by 600,000 BPD.
Meanwhile, talks between the United States and Iran will resume in the coming days, according to the head of EU diplomacy, Josep Borrell. If there is progress on the Iranian nuclear deal, the country’s crude oil will start flowing into the markets as a sign of relief from gasoline shortages and high energy prices.
At the time of writing this article, the news has come across that the president of France, Macron, has communicated to the president of the USA, Biden, that the United Arab Emirates is producing oil almost at full capacity after a conversation with the crown prince of the Emirates. At the same time, the Department of Energy (DOE) reported that strategic reserve oil stocks fell to 497.9 million barrels, the lowest level since April 1986.
Meanwhile, the US Energy Information Administration said the release schedule for its State of the Oil report that was scheduled to come out last week is still unclear, but it will not be released on Monday, according to Bloomberg.
WTI Price Analysis: Technical Outlook
Benchmark US crude oil price is trapped inside the 50 and 100 EMAs on the daily chart, each at $110.33 and $105.88, respectively. However, WTI has a bullish bias as sellers were unable to drag prices below the psychological $100 level.
WTI traders should note that even though WTI fell below a six-month uptrend line last Tuesday, it does not mean that the WTI trend has changed; It’s just slowing down, and oil is already trading close to last Tuesday’s prices as WTI consolidates.
To the upside, the first resistance for WTI would be the 50 EMA at $110.00. If it breaks above, the 20 EMA at $114.94, followed by the latest high from June 14 at $123.66 per barrel.
Technical levels
Source: Fx Street
With 6 years of experience, I bring to the table captivating and informative writing in the world news category. My expertise covers a range of industries, including tourism, technology, forex and stocks. From brief social media posts to in-depth articles, I am dedicated to creating compelling content for various platforms.


