
- WTI price remains vulnerable amid fears of an inevitable global recession.
- The large API crude stockpile and Biden’s suspension of the federal gasoline tax weigh on oil.
- Any rebound in WTI will likely be sold as bears keep their eyes on $100.
WTI (NYMEX futures) is reversing a decline to the $101 level as the bears take a breather before the next push lower.
A combination of bearish factors continues to maintain downside exposure in WTI, despite the latest bounce. The increased odds of a global recession weigh on sentiment around black gold. Preliminary Eurozone PMIs disappointed and reignited fears of a recession.
On the other hand, the large accumulation of stocks in the US, together with President Joe Biden’s fiscal delay for gasoline, contribute to increasing the weight of the oil price. The American Petroleum Institute (API) reported this week a crude accumulation of 5,607,000 barrels. It is the biggest rise in inventories of more than 5 million barrels since mid-February.
On Wednesday, Biden urged Congress to pass a three-month suspension of the federal gas tax to help combat record prices at the pump. All eyes are now on US PMIs and Wall Street sentiment to find new trading opportunities in WTI.
Notably, the US Energy Information Administration said its weekly crude stock change data, due for release on Thursday, will be delayed due to systems problems until at least next week.
From a short-term technical perspective, WTI is likely to challenge the upsloping 100-day moving average at $104.37, which was critical support the previous day.
Acceptance above this latter level will trigger a further rally towards $105, above which the gates to the horizontal 50 SMA at $109.09 will open.
WTI daily chart
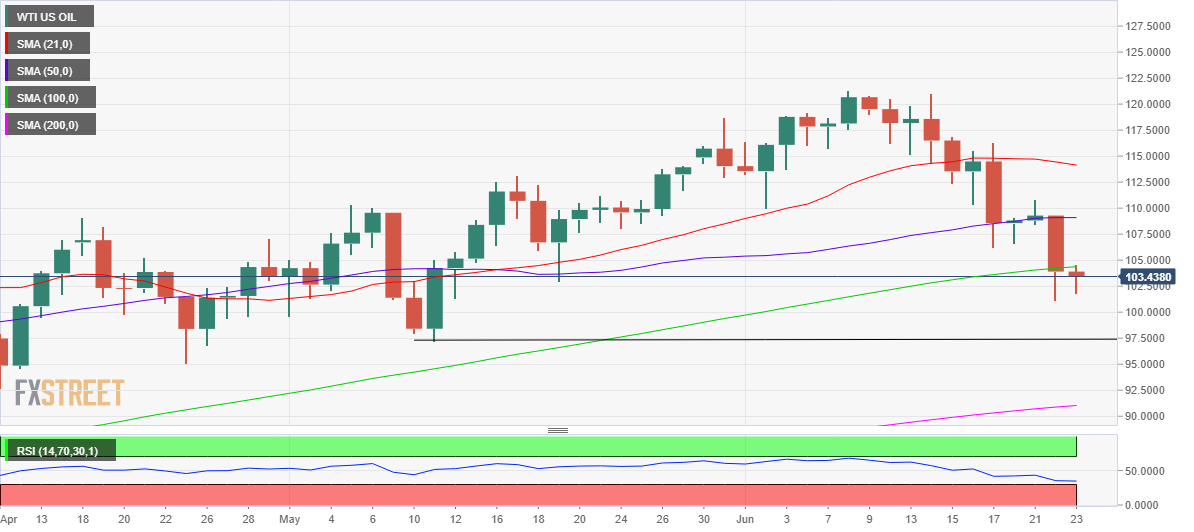
The 14-day RSI is just above the oversold region, which suggests that any recovery could be a good selling opportunity.
The immediate downside target is Wednesday’s low of $101.17, below which a further decline towards the $100 level will start.
Further down, the May 11 low of $97.21 will be on sellers’ radar.
WTI additional technical levels
Source: Fx Street
With 6 years of experience, I bring to the table captivating and informative writing in the world news category. My expertise covers a range of industries, including tourism, technology, forex and stocks. From brief social media posts to in-depth articles, I am dedicated to creating compelling content for various platforms.


