
- WTI trimmed some of its weekly losses, bolstered by dollar weakness.
- Easing inflation in the US has weakened the dollar as traders brace for a less aggressive Fed.
- Chinese refiners asked Saidu Aramco to cut December crude oil volumes, limiting the recovery in WTI.
The Western Texas Intermediate (WTI), US oil benchmark recovers some ground during the North American session after the US inflation report reported easing prices. Another factor that boosted the appetite for Oil is China’s easing of Covid-19 restrictions, which underpinned oil prices. At the time of writing, WTI is trading at $88.29 per barrel, up 2.37%.
Sentiment remains positive as colder-than-expected US Consumer Price Index (CPI) data showed that the US economy is feeling the impact of Federal Reserve monetary policy. ). Headline inflation came in at 7.7% yoy and core CPI fell to 6.3% yoy, both below expectations. Following the release, speculation mounted that the Fed might gradually raise the Federal Funds Rate (FFR) instead of raising rates by 75 basis points. The reflection is that the odds of a 50 basis point Fed rate hike in December jumped from 50% to 85%.
Therefore, the dollar weakened across the board as the Dollar Index slumped 3.76% on the week, undermined by US Treasury yields, which tumbled nearly 30 basis points.
Separately, Chinese authorities announced that quarantines for incoming travelers would be reduced from two to five days, a sign welcomed by investors.
According to Reuters, several Chinese refiners asked Saudi Aramco to cut crude oil volumes loaded in December, meaning the Chinese economy is reporting a slowdown as it struggles to avoid a recession.
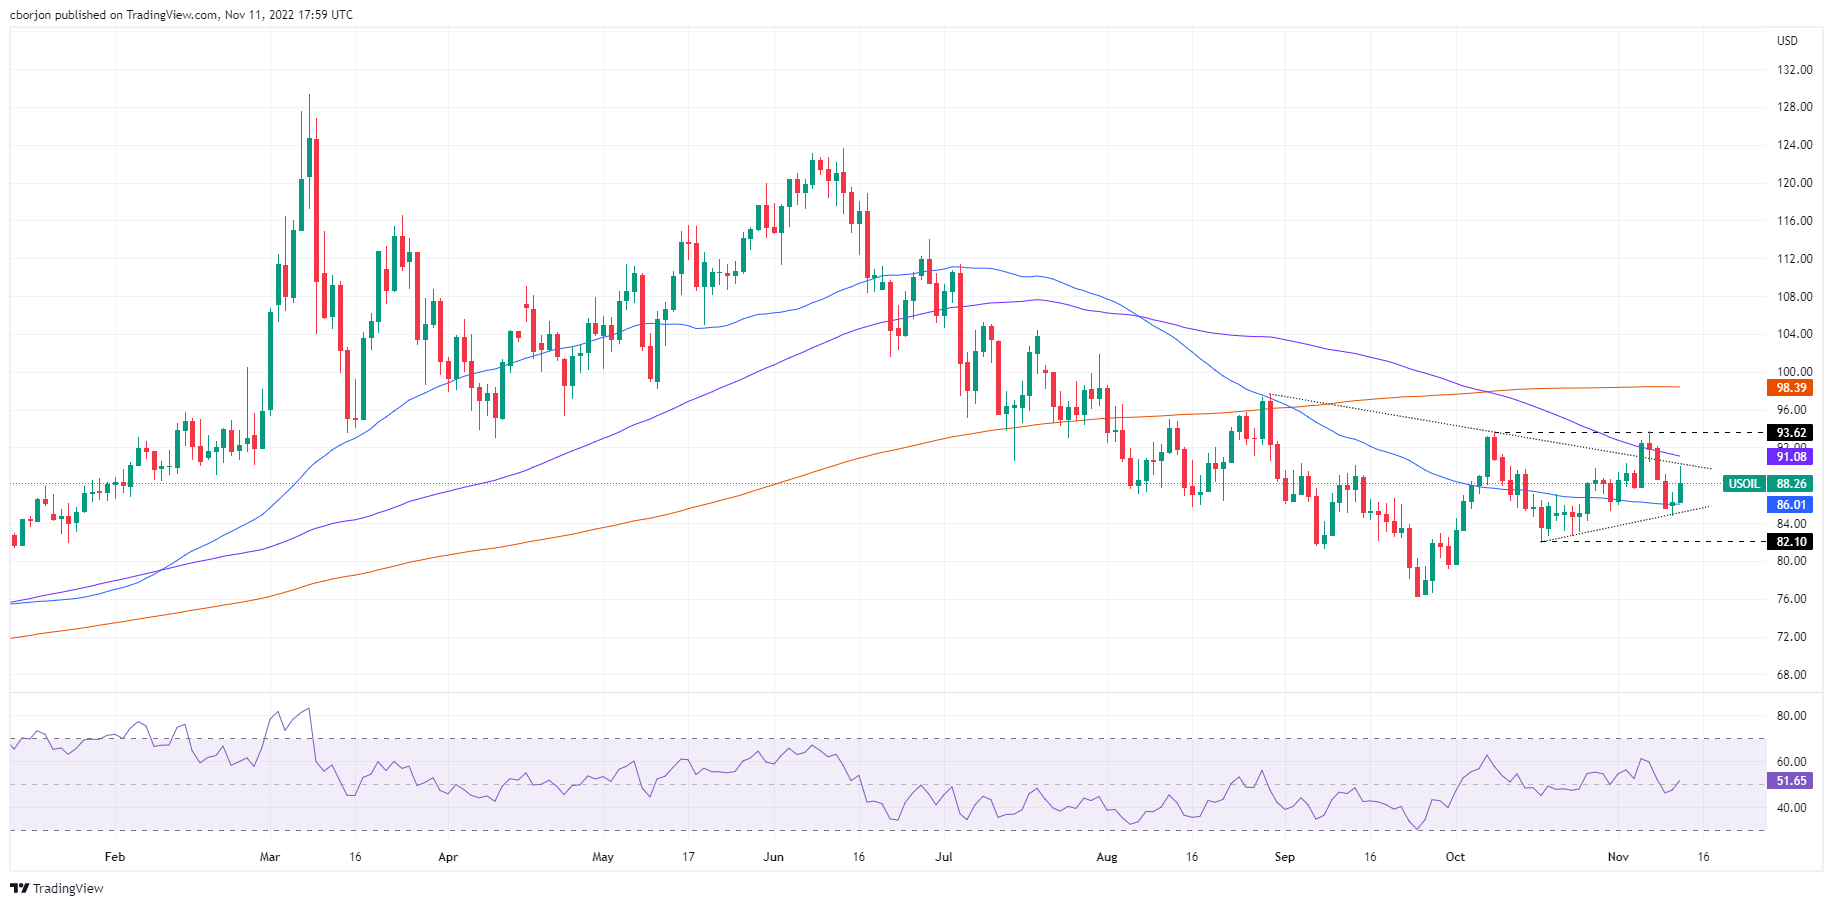
WTI Price Analysis: Technical Outlook
WTI has a neutral bias as the daily chart shows. Notably, Friday’s daily high at $90.08 tested a month-old downtrend line drawn from the September highs. However, WTI was quickly rejected and pulled back above November’s daily high at $87.31. The Relative Strength Index (RSI) in bullish territory suggests that Oil prices could rise. However, WTI needs to break above the $90.00 signal, along with the 100 day EMA at $91.07, for the bias to be neutral to bullish.
Source: Fx Street
With 6 years of experience, I bring to the table captivating and informative writing in the world news category. My expertise covers a range of industries, including tourism, technology, forex and stocks. From brief social media posts to in-depth articles, I am dedicated to creating compelling content for various platforms.


