
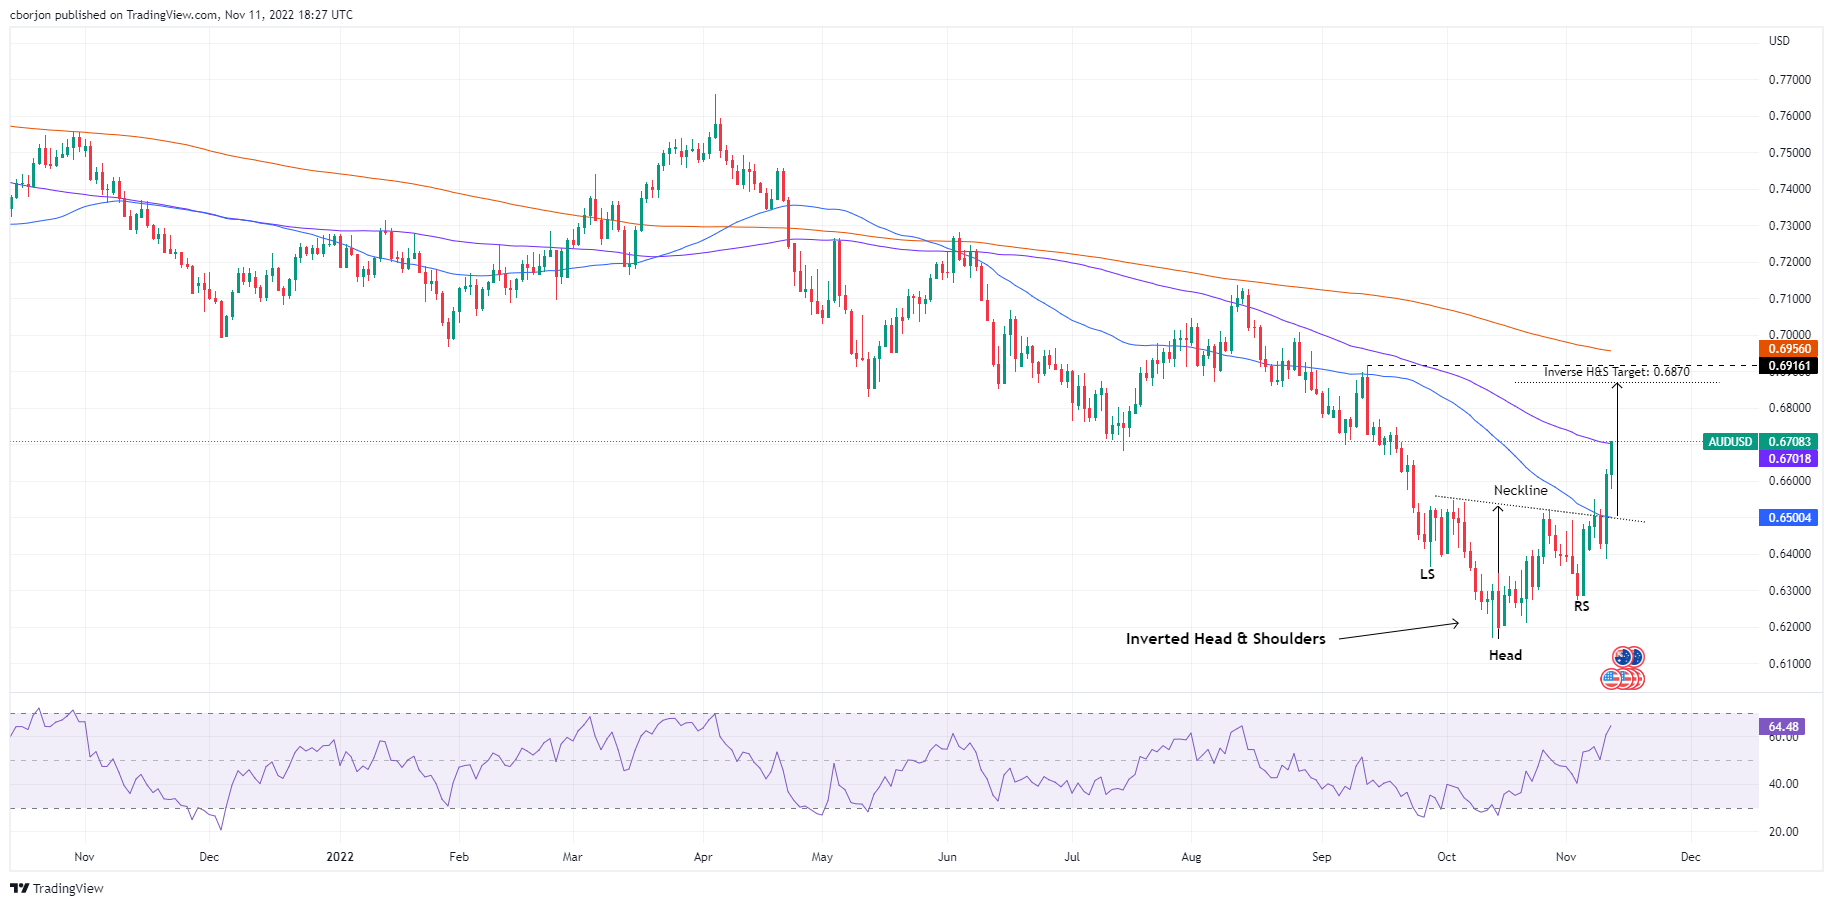
- AUDUSD tests the 100 day EMA, driven by an inverted head and shoulders chart pattern.
- Once the head and shoulders pattern is reached, the AUUSD could extend its gains towards the 200 day EMA.
The AUDUSD is rising strongly in the North American session and challenges the 100 day EMA at 0.6701. Fundamental factors, but also an inverted head and shoulders chart pattern on the AUDUSD daily chart, underpinned the Australian dollar (AUD), which is gaining 1.24%. At the time of writing, the AUDUSD is trading at 0.6701 after hitting a daily low of 0.6577.
AUDUSD Price Analysis: Technical Outlook
The AUDUSD daily chart shows the US dollar breaking above the inverted head and shoulders neckline on Thursday, November 11. It should be noted that during that day, the AUDUSD made a daily low of 0.6412. But a softer US Consumer Price Index (CPI) report lifted AUDUSD, which rose almost 190 points.
At the time of this writing, the AUDUSD is probing the 100 day EMA, which, once breached, could pave the way for further gains. The Relative Strength Index (RSI) is in the bullish zone. Therefore, the path of least resistance in the AUDUSD has a bullish bias.
The first resistance for AUDUSD would be the 100 day EMA at 0.6701. The break above will expose the psychological mark of 0.6800, followed by the inverted head and shoulders target at 0.6870. However, the break of this last mark will pave the way towards key resistance zones such as the 13th September high at 0.6916 and the 200 day EMA at 0.6956.
AUDUSD Key Technical Levels
Source: Fx Street
With 6 years of experience, I bring to the table captivating and informative writing in the world news category. My expertise covers a range of industries, including tourism, technology, forex and stocks. From brief social media posts to in-depth articles, I am dedicated to creating compelling content for various platforms.


