
- DXY with an intraday bullish bias, moving around 110.00.
- Further rally could lead to a new cycle high near 110.80.
The Dollar Index (DXY) resumes gains after Friday’s decline.
Despite the ongoing consolidation, the near-term dollar’s bullish view remains unchanged as it stands above the 7-month support line near 106.50. On the contrary, for the time being a further move higher towards the high of the last few years around 110.80 is still possible.
In the longer term, DXY is expected to maintain its constructive stance as long as it is above the 200 SMA at 101.73.
DXY day chart
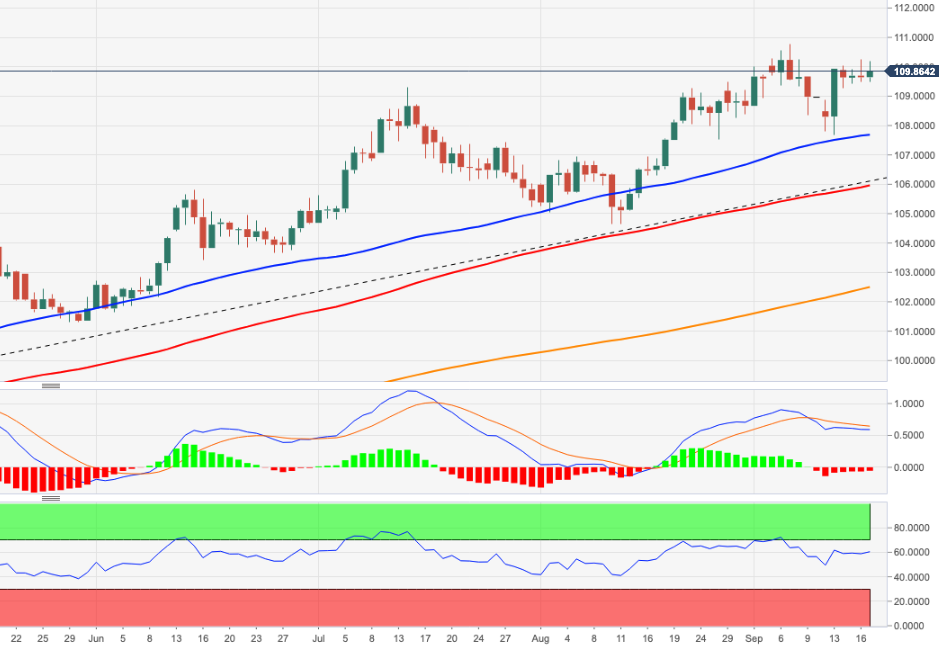
Source: Fx Street
With 6 years of experience, I bring to the table captivating and informative writing in the world news category. My expertise covers a range of industries, including tourism, technology, forex and stocks. From brief social media posts to in-depth articles, I am dedicated to creating compelling content for various platforms.


