
- EUR/GBP is back trading within a multi-month range after temporarily breaking higher.
- It could now continue falling towards the lows of the range, with support at the 50 and 100 moving averages on the way.
- The pair is in a sideways trend that continues to extend.
The EUR/GBP pair has fallen back within its multi-month range after temporarily breaking higher on May 7.
The retracement within the range continues the sideways trend of the pair. This trend is expected to continue given the old saying that “the trend is your friend.”
EUR/GBP Daily Chart
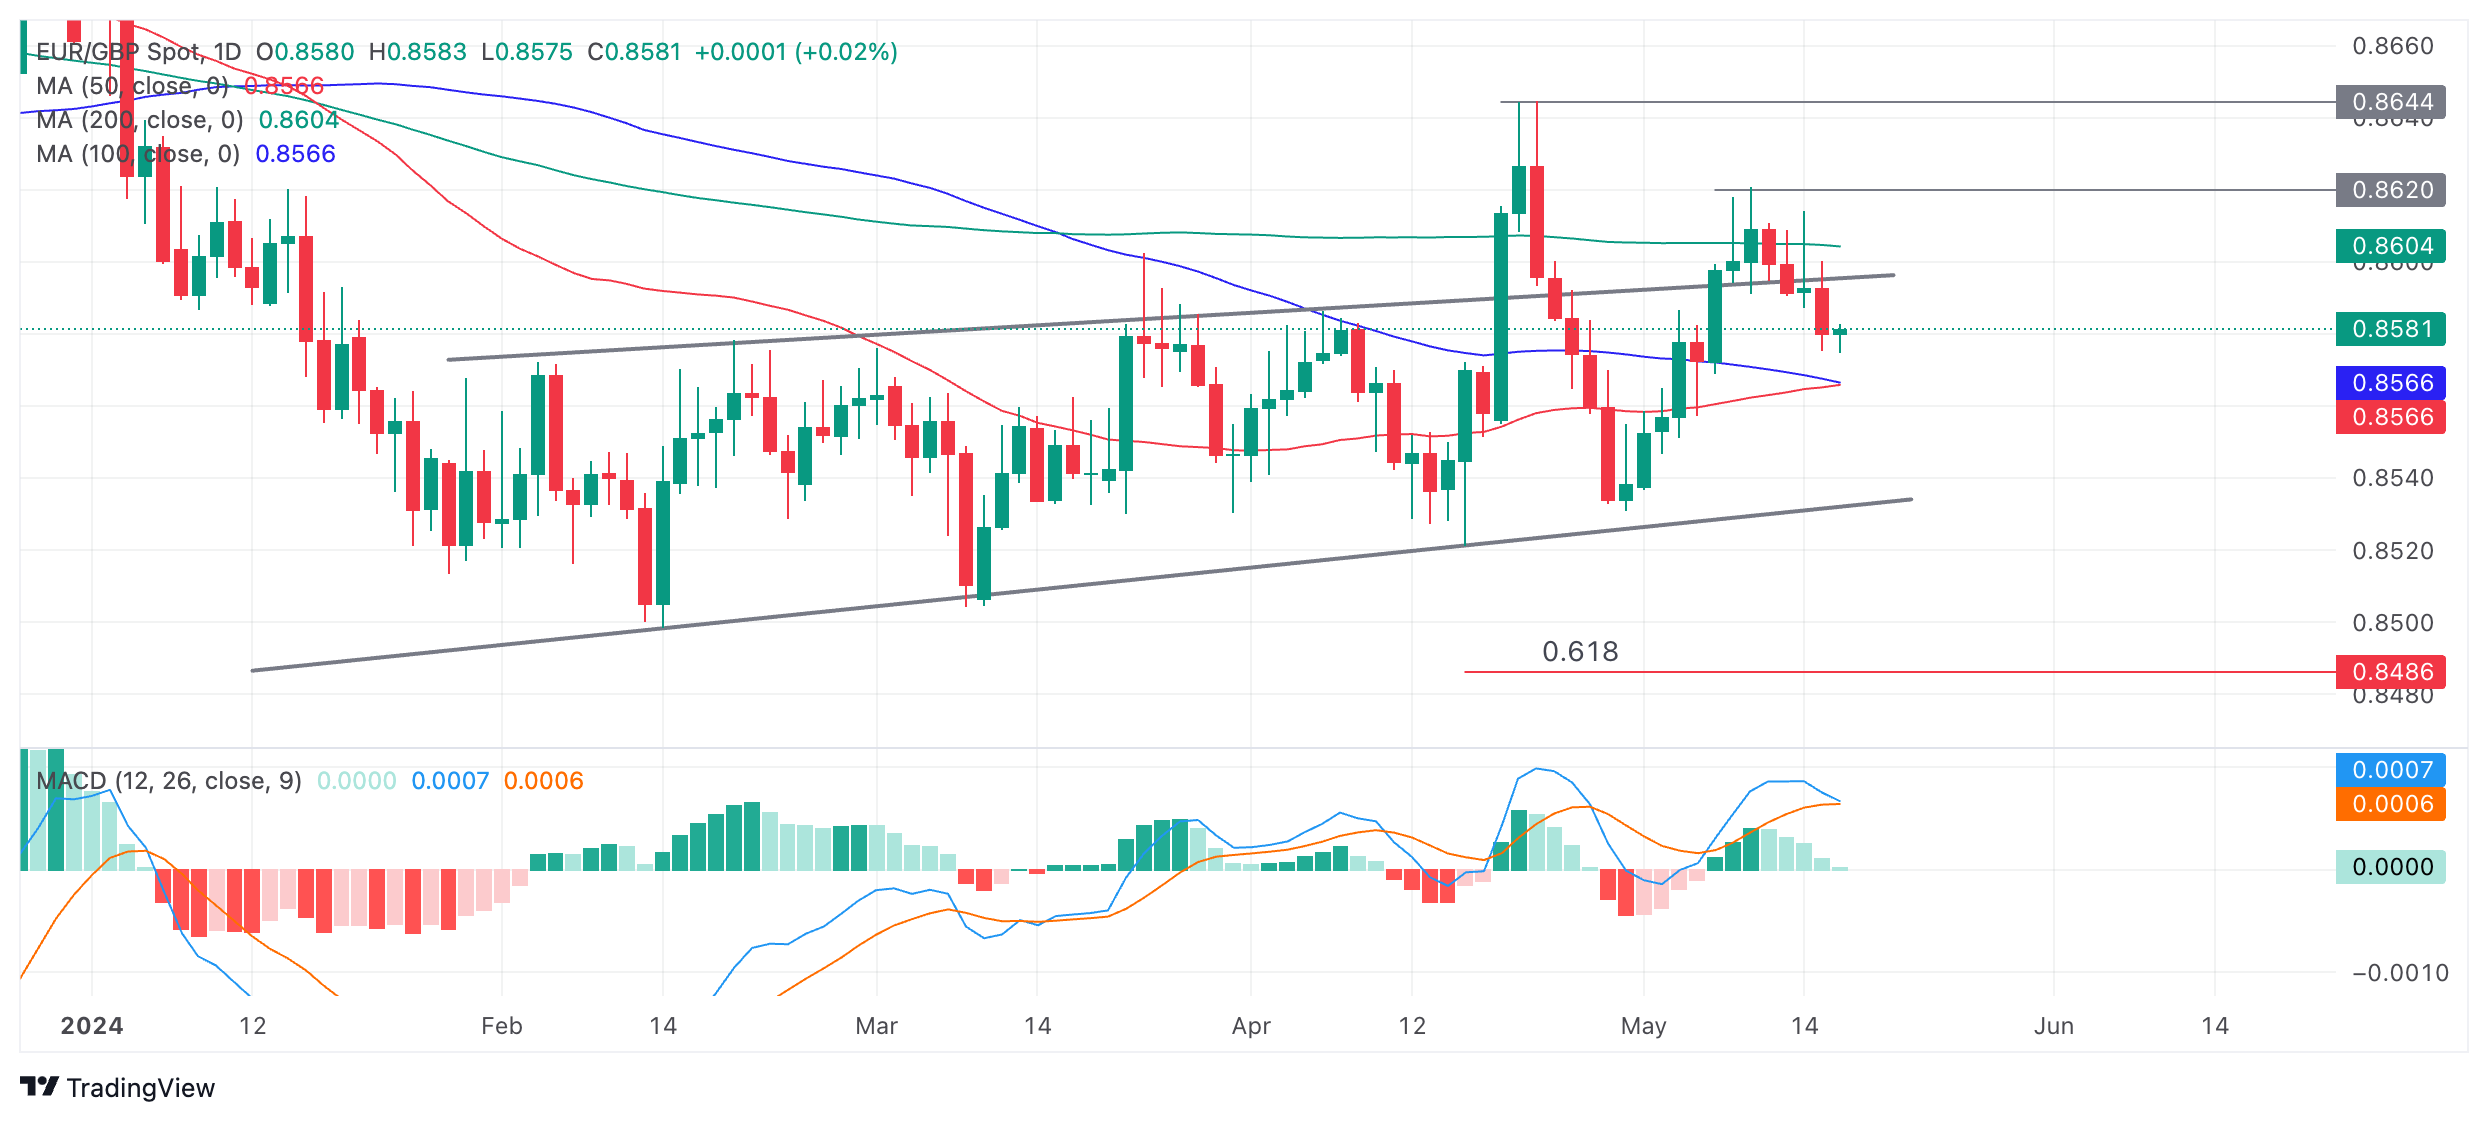
EUR/GBP has re-entered its medium-term range. There is a possibility that the pair could pull back towards the support around 0.8540.
However, two major moving averages, the 50-day and 100-day SMA, are converging at 0.8566, and are likely to act as a barrier to the downside. Therefore, EUR/GBP could take a pause if it falls to that level.
The MACD (Moving Average Convergence Divergence) indicator threatens to cross below its red signal line. If this crossover is confirmed (on daily close) it will add more bearish evidence suggesting that EUR/GBP will continue to decline within the range/channel.
For a sideways trend reversal, EUR/GBP would need a decisive break below the range lows or above the April 23 high.
In the event of a break below the range lows, the first bearish target would be 0.8486, the 0.618 Fibonacci ratio of the range height extrapolated downward from the channel base. This is the method commonly used by technical analysts to estimate range breaks. Further weakness could lead the price to reach the next target at 0.8460, the full height of the extrapolated downward range.
A decisive breakout would be one characterized by a long candlestick breaking completely below the range floor and closing near its low, or three consecutive red candlesticks clearly breaking through the level.
The top of the range has already been breached several times, suggesting it has weakened and providing a less reliable level of resistance. To confirm a new uptrend now, EUR/GBP would not only have to break above the top of the range, but also above the April 23 high at 0.8644. On the way up, 0.8620 (May 9 high) would provide resistance.
Source: Fx Street
I am Joshua Winder, a senior-level journalist and editor at World Stock Market. I specialize in covering news related to the stock market and economic trends. With more than 8 years of experience in this field, I have become an expert in financial reporting.


