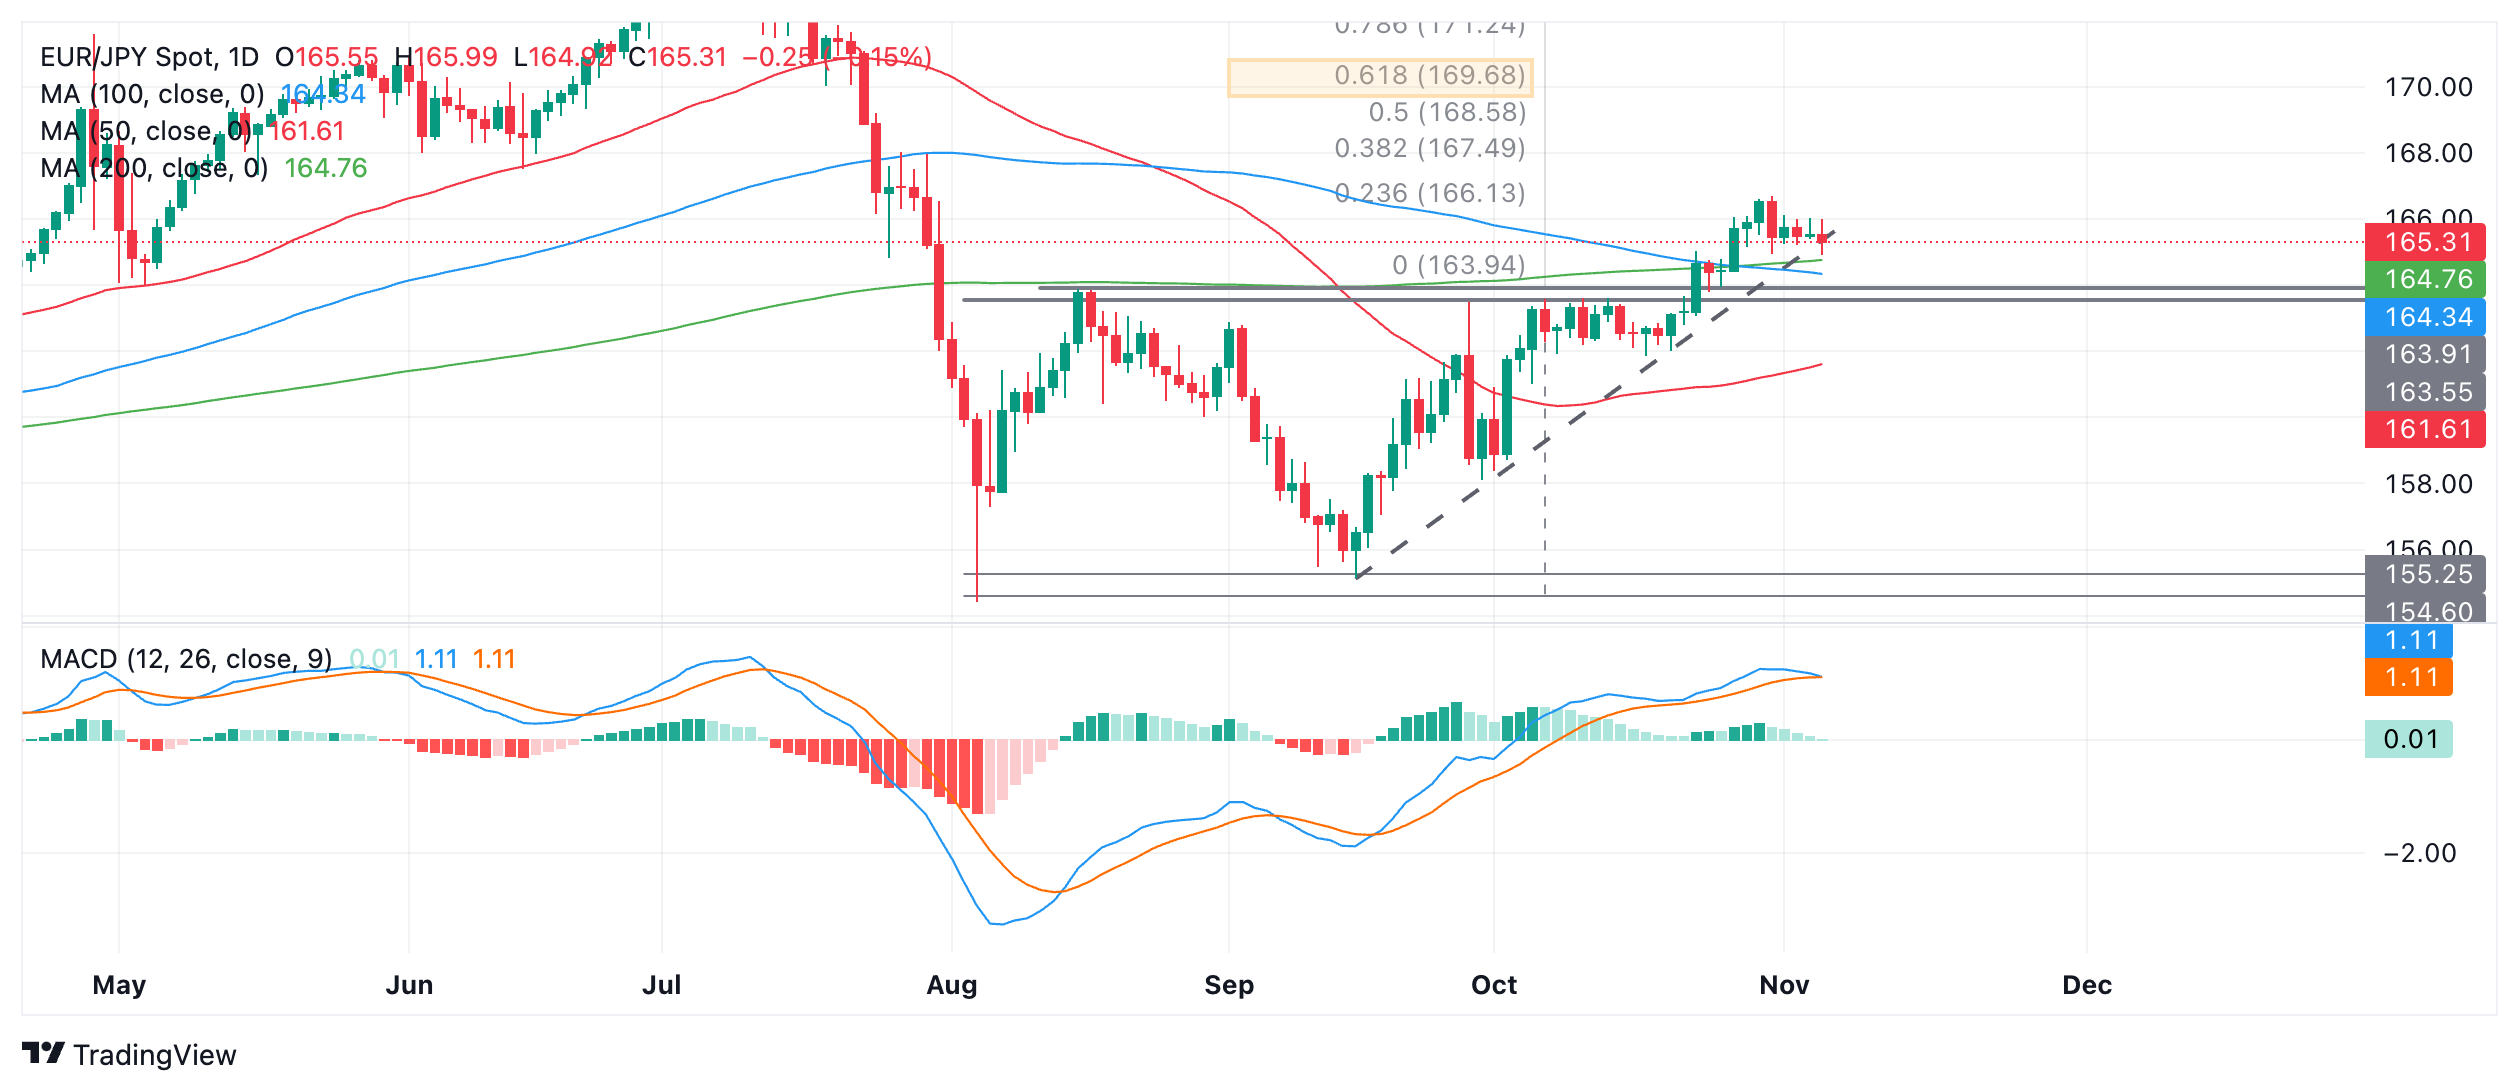
- EUR/JPY retreats towards the trend line of the recent recovery from the September lows.
- If it breaks higher, it could start an extension towards a target at 169, the MACD is bearish, however.
EUR/JPY continues its pullback towards the trend line (dashed line on the chart) of the September-October recovery.
The pair is in an uptrend in the short and medium term, which, given the axiom of technical analysis that “the trend is your friend”, is favored to continue upwards.
EUR/JPY Daily Chart
A break above 166.69 (October 31 high) would likely confirm such upside continuation.
Resistance at 167.96 (July 30 high) could provide an initial target and act as a barrier to further upside.
The minimum target for the range breakout, however, lies higher, at 169.68, the 61.8% Fibonacci extrapolation of the height of the upward range (orange shaded rectangle).
The Moving Average Convergence/Divergence (MACD) threatens to cross below its signal line, however, it is a slightly bearish signal that could indicate further short-term weakness for the pair.
There is also an open gap just below the price that is only visible on the intraday charts at 164.90. The gaps tend to be filled. If so, there could be more weakness on the horizon, with the price falling to the bottom of the open gap at 164.45.
Source: Fx Street
I am Joshua Winder, a senior-level journalist and editor at World Stock Market. I specialize in covering news related to the stock market and economic trends. With more than 8 years of experience in this field, I have become an expert in financial reporting.


