
- On the hourly chart of the EUR/USD, the price is moving within the spiral along the trend line support.
- The trend line will be vulnerable if the US data on Friday matches the strong data on Thursday, exposing the 1.08 figure to the downside.
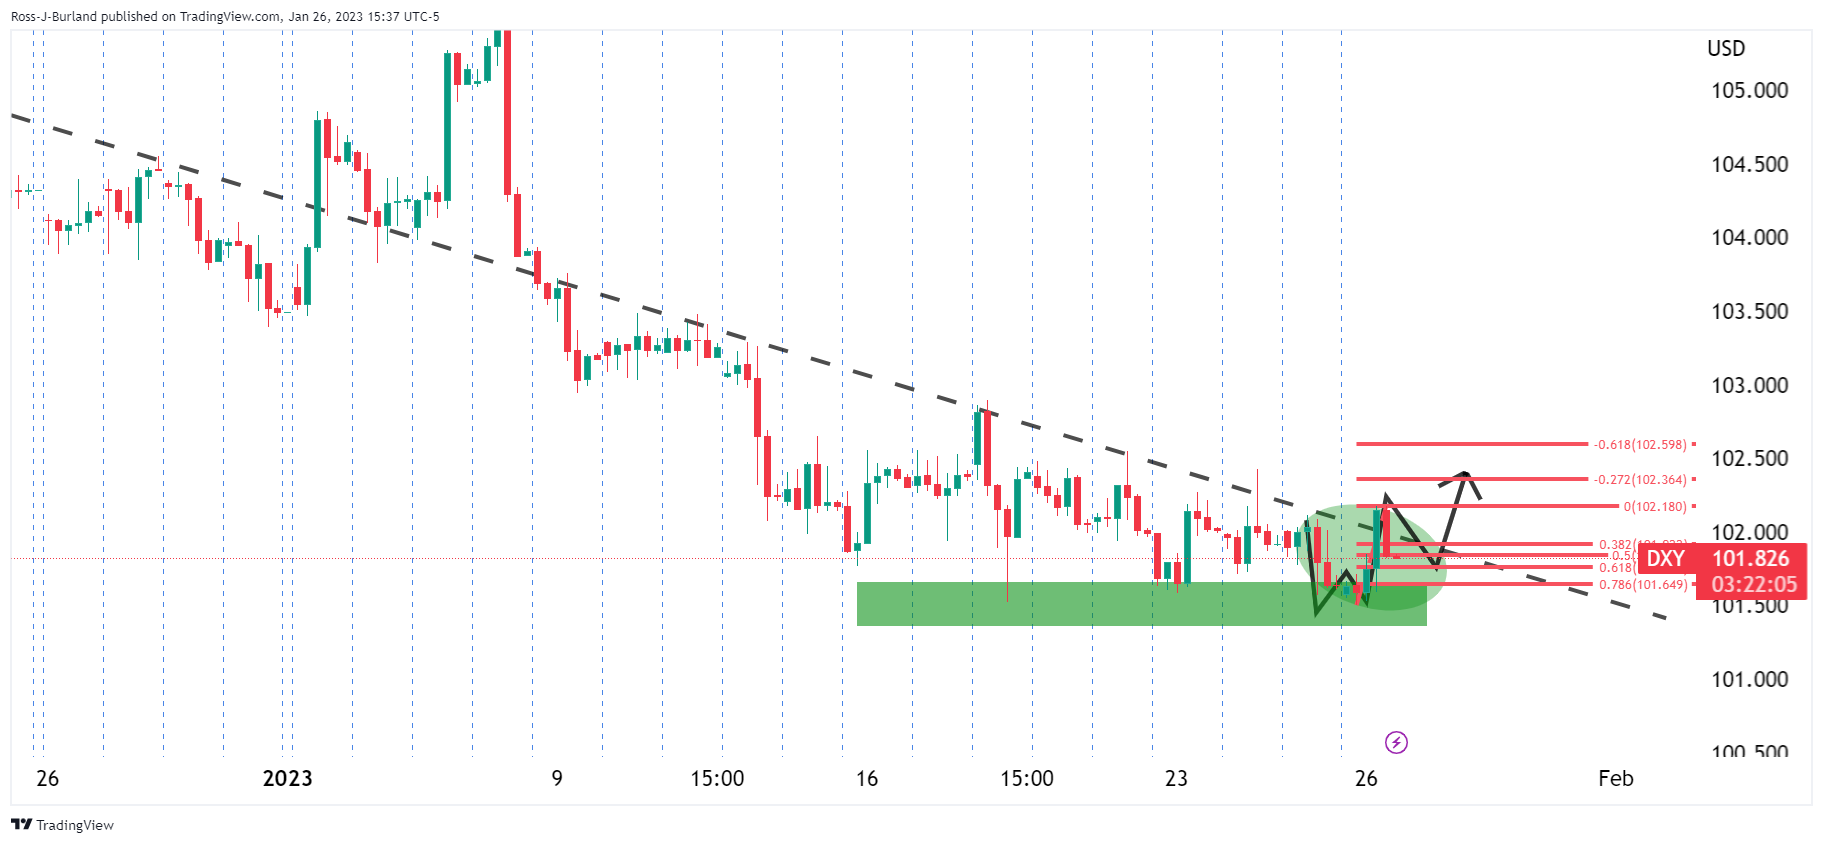
The pair EUR/USD it is rising in the latter part of the US session, after a dip triggered by strong US data on Thursday. The US dollar (DXY) has benefited from this and has teased the markets today, testing the resistance of the key trend line at the 102 level.
The pullback to the neckline of the W formation is leading to a bid in the Euro:
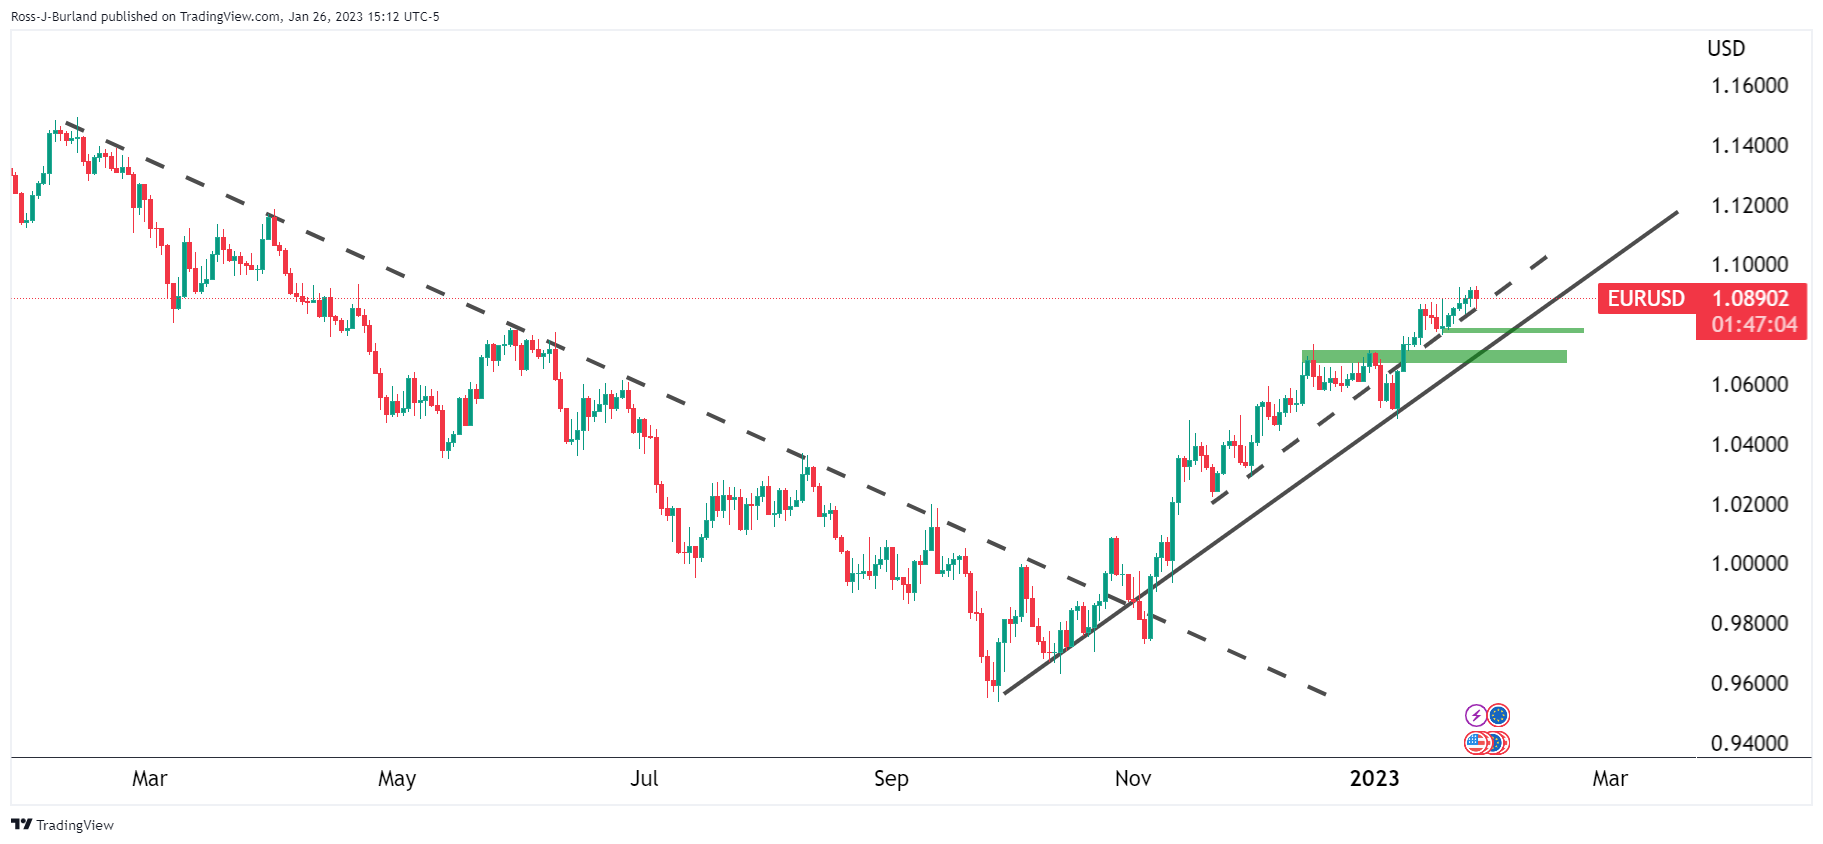
EUR/USD daily chart
EUR/USD H4 chart
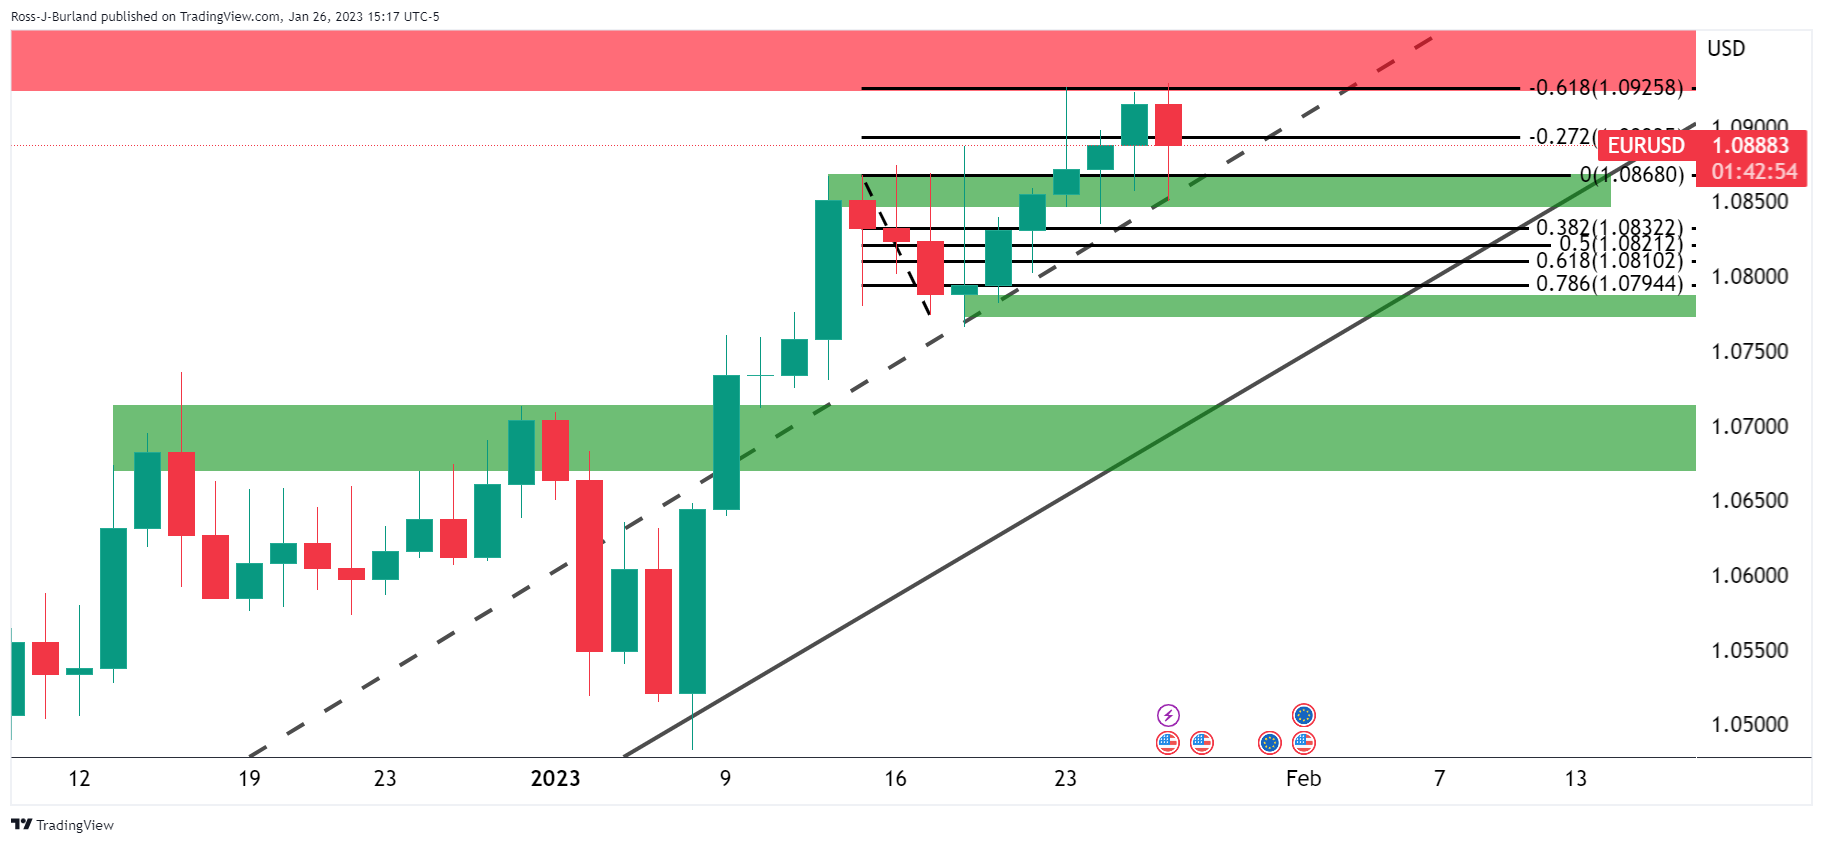
On the 4-hour chart, we have the bulls targeting 1.0925 and updating highs, strongly approaching the neckline in the M formation. However, we are at the highs and the price is in a spiral, which means that a breakup could be imminent. This could be before the Federal Reserve, but we’re guaranteed some price action before Friday’s big data on the US calendar:
EUR/USD H1 chart
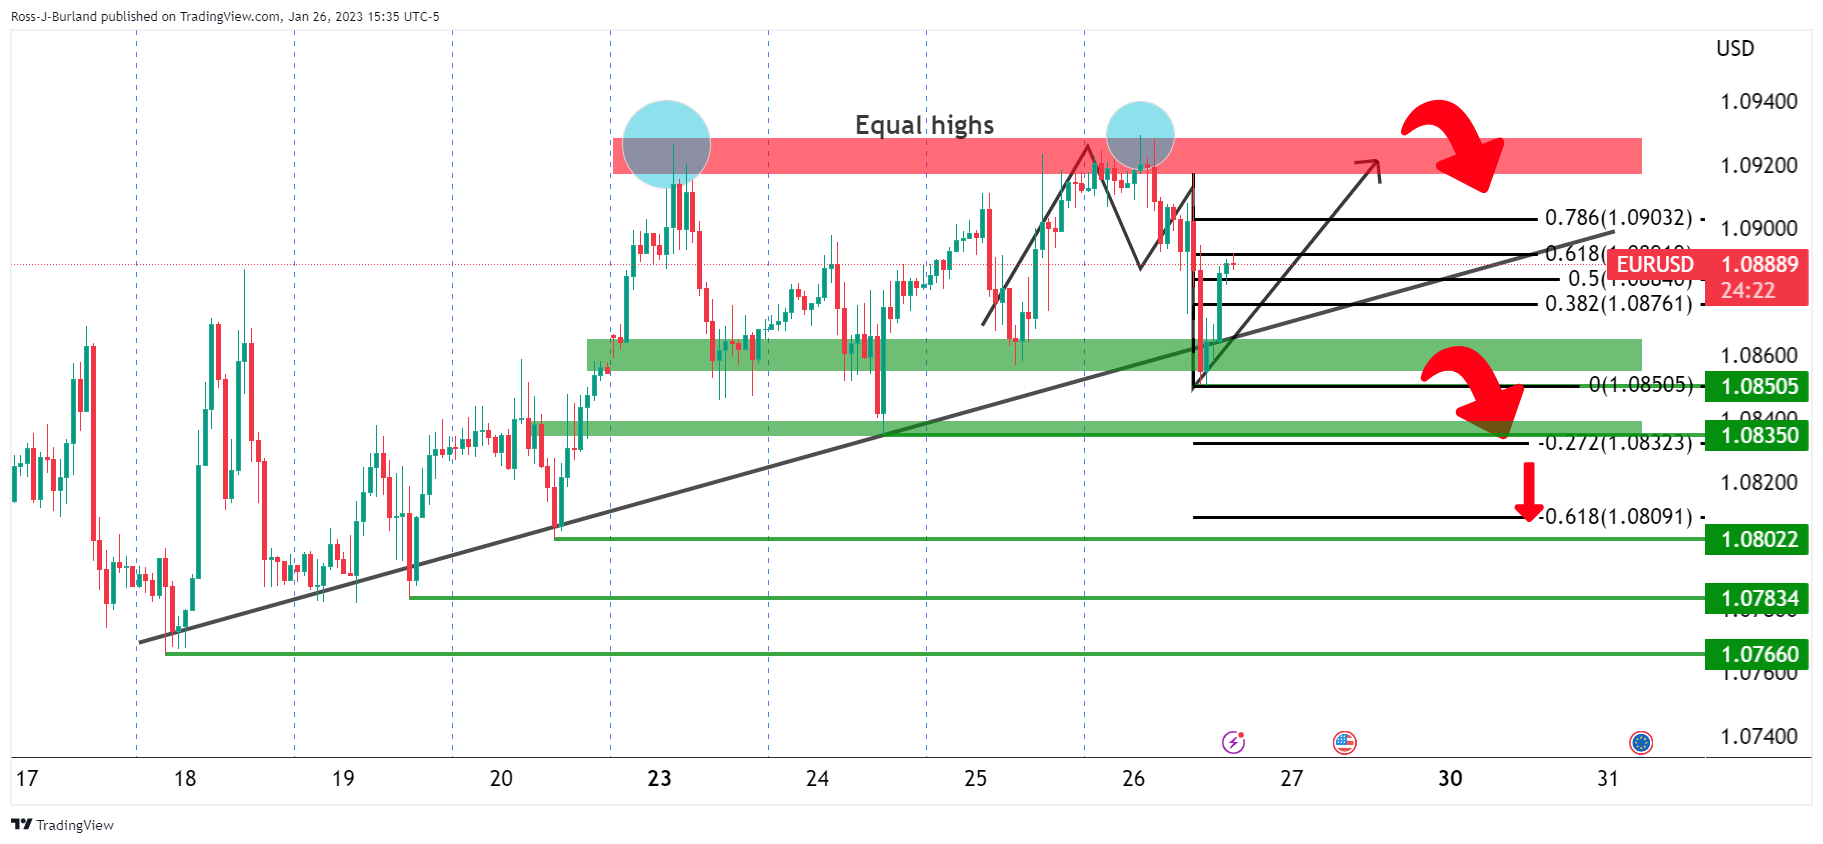
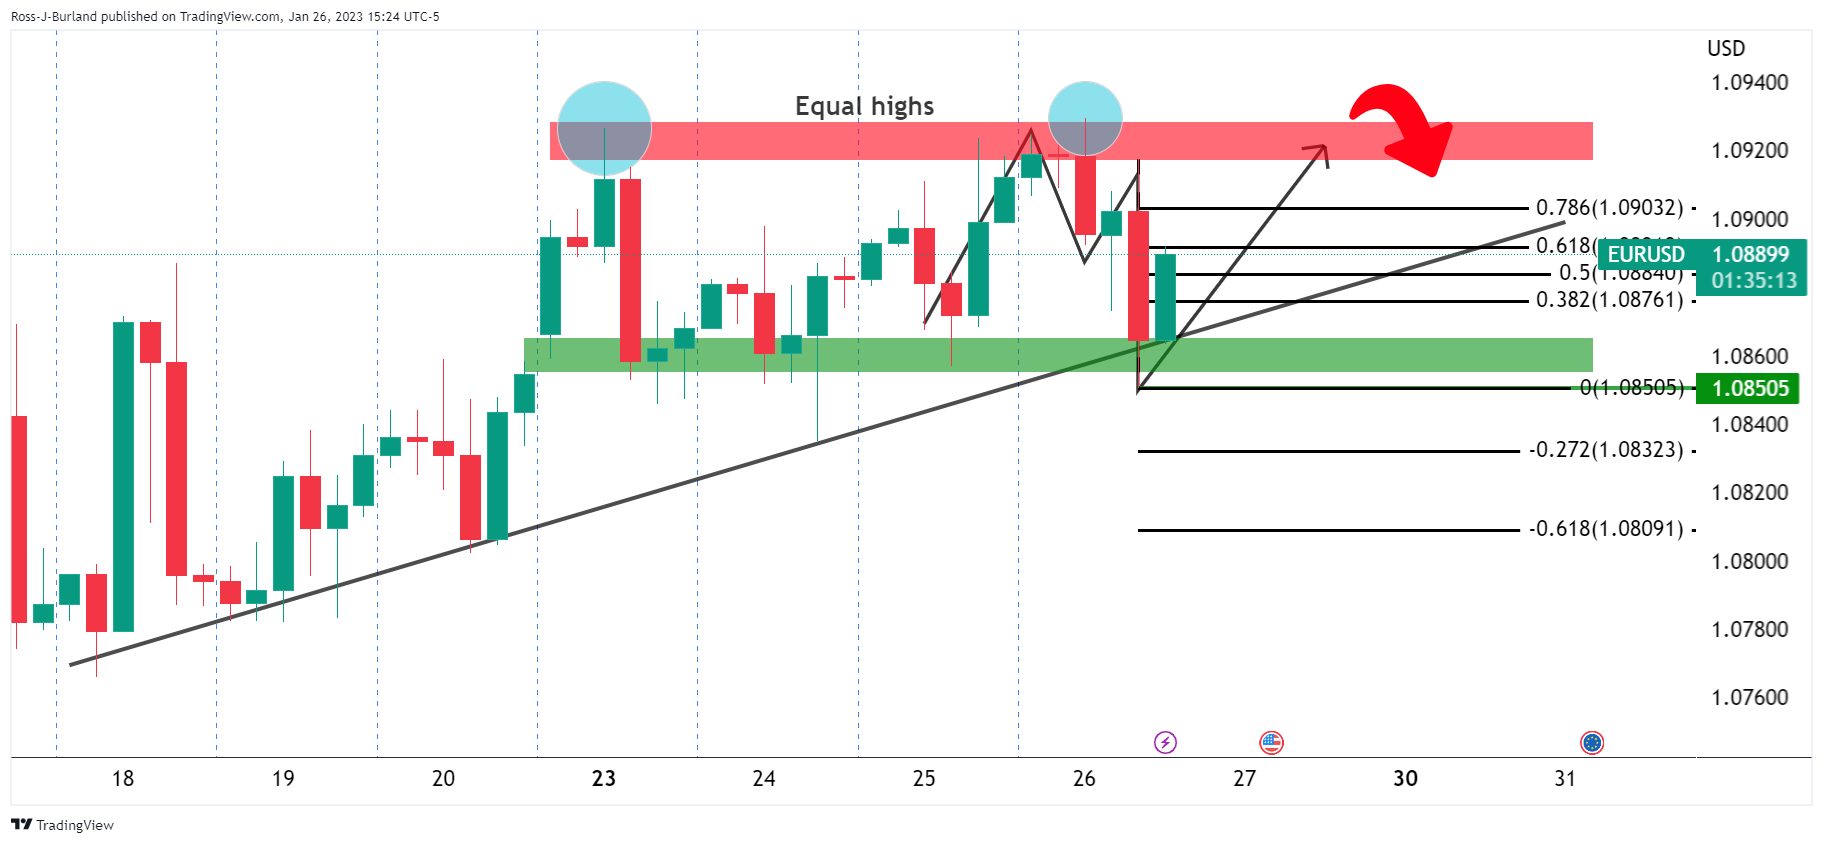
On the hourly chart, price is above trend line support which will be vulnerable if Friday’s data matches Thursday’s, exposing the 1.08 level to the downside.
Source: Fx Street
I am Joshua Winder, a senior-level journalist and editor at World Stock Market. I specialize in covering news related to the stock market and economic trends. With more than 8 years of experience in this field, I have become an expert in financial reporting.


