
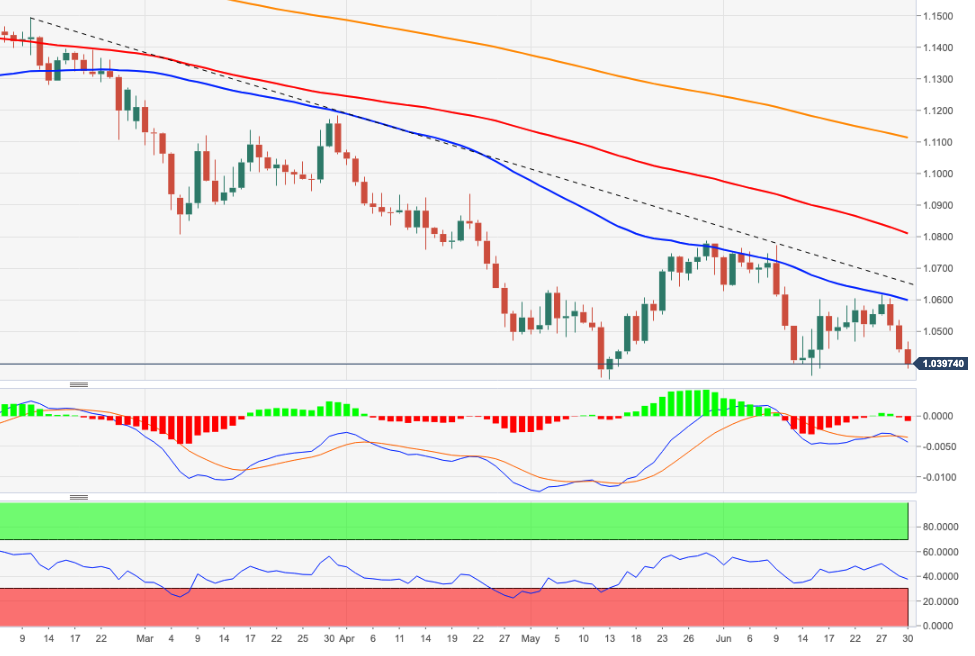
- EUR/USD continues to offer and breaks 1.0400.
- The next move down is the June low at 1.0358.
The EUR/USD keeps the leg down so far this week and now breaks below the 1.0400 support to hit fresh 2-week lows.
The inability to break out of the 4-month line near 1.0640 should keep the bearish pressure around the pair. That said, if the selling trend gathers more momentum, then another visit to the June low at 1.0358 (15 Jun) before the 2022 low at 1.0348 (13 May) could start to appear on the horizon.
Longer term, the bearish view on the pair is expected to prevail as long as it trades below the 200-day SMA at 1.1112.
EUR/USD daily chart
Technical levels
Source: Fx Street
With 6 years of experience, I bring to the table captivating and informative writing in the world news category. My expertise covers a range of industries, including tourism, technology, forex and stocks. From brief social media posts to in-depth articles, I am dedicated to creating compelling content for various platforms.


