
- EUR/USD regains composure after earlier drop near 0.9900.
- Bullish attempts should find the initial hurdle near 1.0100.
EUR/USD reverses early pessimism, including a test of the 0.9900 area on Monday.
The recent failure to advance beyond 1.0100 leaves this region as a potential short-term top, while the 0.9900 neighborhood looks to offer decent enough containment at the moment. The break of the 2022 low at 0.9899 (Aug 23) could lead to a deeper pullback to the Dec 2002 low at 0.9859.
In the long term, the bearish view on the pair is expected to prevail as long as it trades below the 200-day SMA at 1.0819.
EUR/USD daily chart
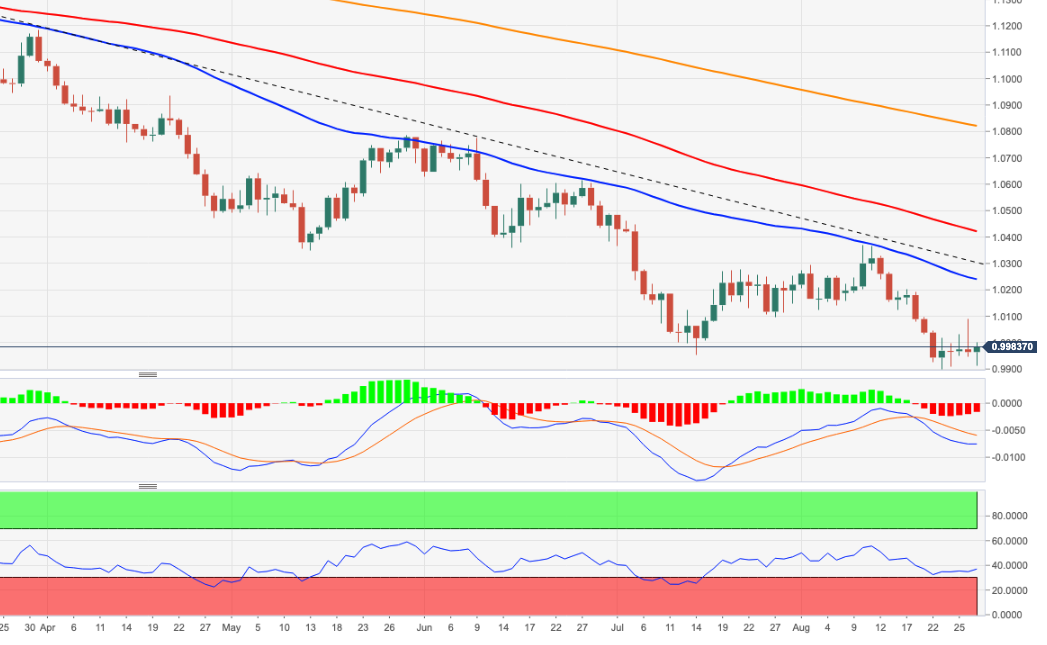
Source: Fx Street
With 6 years of experience, I bring to the table captivating and informative writing in the world news category. My expertise covers a range of industries, including tourism, technology, forex and stocks. From brief social media posts to in-depth articles, I am dedicated to creating compelling content for various platforms.


