
- GBP/USD falls to 1.2683, marking a new four-week low of 1.2656 amid risk aversion.
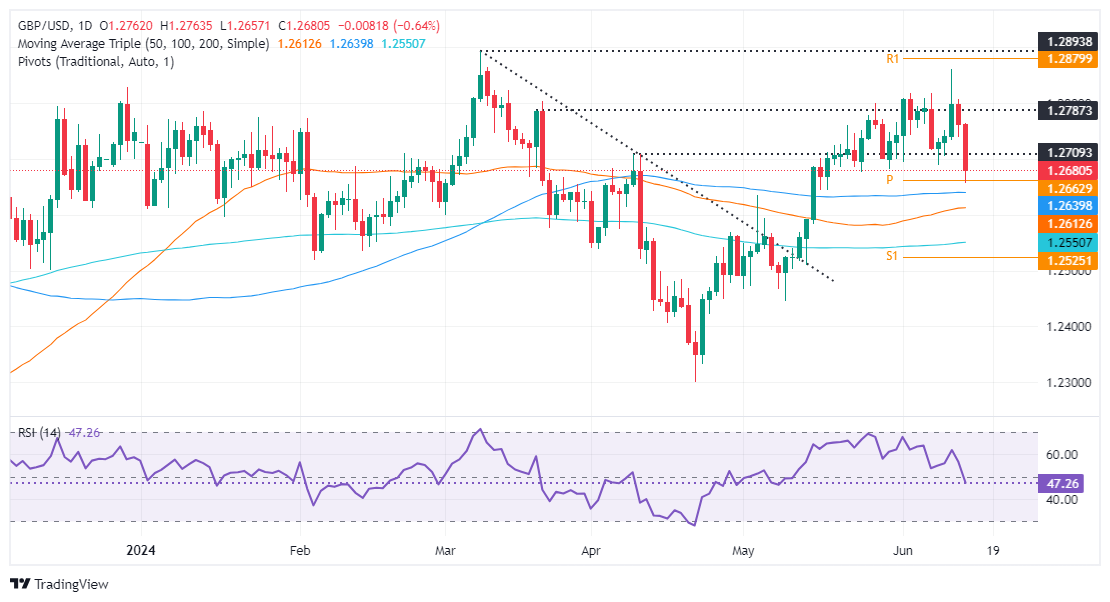
- Technical Outlook: Momentum is bearish as RSI falls below 50; potential support at 1.2643/38, 50-day SMA at 1.2611 and 200-day SMA at 1.2547.
- Resistance at 1.2700; if surpassed, consolidation in the range of 1.2700-1.2750 is expected.
The British Pound fell sharply below 1.2700 as risk aversion affected most G7 currencies except safe-haven pairs such as the Dollar. Political turmoil in Europe caused the Euro to collapse against the Swiss Franc, while GBP/USD fell 0.62% and was trading at 1.2683 at the time of writing.
GBP/USD Price Analysis: Technical Perspective
From a technical point of view, GBP/USD has changed from neutral to bearish bias, with momentum hinting that sellers are gaining traction. The Relative Strength Index (RSI) has fallen below 50, turning bearish, while price action shows the pair printing a new four-week low of 1.2656, opening the door for additional losses.
If GBP/USD breaks through the confluence of the 100-day moving average (DMA) and the May 3 high-turned-support around 1.2643/38, that would accelerate the downtrend, exposing the 50-day SMA at 1.2611, before 1.2600. Further losses are expected below the figure, with the 200-day SMA at 1.2547 as the next target.
Conversely, if buyers step in and recapture 1.2700, GBP/USD could consolidate around 1.2700-1.2750 as resistance lies after those levels.
GBP/USD Price Action – Daily Chart
Source: Fx Street
I am Joshua Winder, a senior-level journalist and editor at World Stock Market. I specialize in covering news related to the stock market and economic trends. With more than 8 years of experience in this field, I have become an expert in financial reporting.


