
- GBP/USD trades down more than 0.10% during Jerome Powell’s Senate appearance.
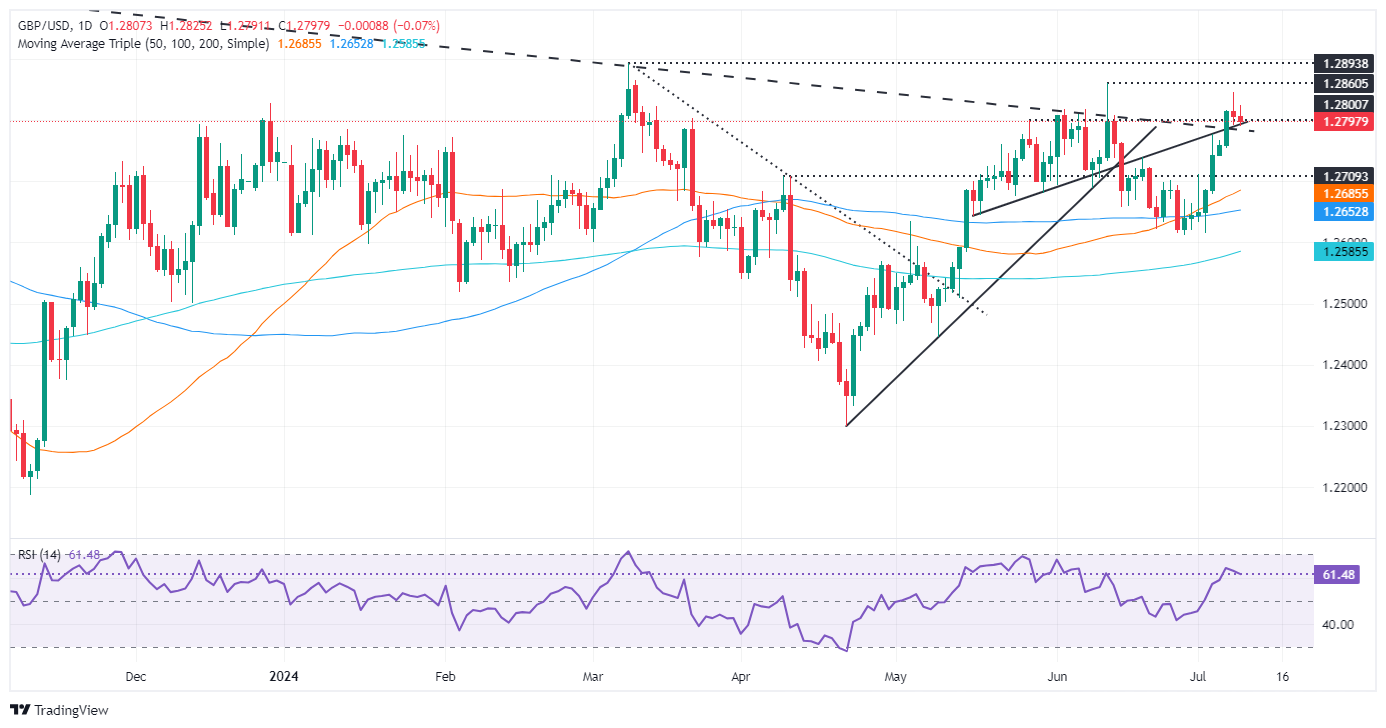
- The ‘shooting star’ pattern suggests further declines if the July 8 low of 1.2785 is broken.
- Key support levels are seen at 1.2750/75 and 1.2709, while resistance lies at 1.2845 and 1.2860.
GBP/USD is falling during the North American session as Federal Reserve Chairman Jerome Powell appears before the US Senate Banking Committee. At the time of writing, the pair is trading with minimal losses of 0.10%, just below the 1.2800 figure.
GBP/USD Price Analysis: Technical Outlook
GBP/USD’s uptrend remains intact, but the formation of a ‘shooting star’ in Monday’s price action suggests the pair could head lower if spot prices fall below the July 8 low of 1.2785.
Momentum, as measured by the Relative Strength Index (RSI), favors buyers, but they are losing strength as the RSI slope is pointing slightly downwards.
In the near term, if GBP/USD manages a daily close below the July 8 low, a bearish three-candlestick ‘evening star’ pattern would emerge, opening the door for further losses. In that case, the pair’s first support would be the confluence of two trend supports around 1.2750/75. Once cleared, the British Pound could fall towards the April 9 high at 1.2709 before challenging 1.2700.
Conversely, if buyers defend 1.2800, it could pave the way for a resumption of the uptrend. The first level of resistance would be the July 8 high at 1.2845, followed by the June 12 peak at 1.2860. Once those two levels are cleared, buyers can challenge the yearly high just below 1.2900.
GBP/USD Price Action – Daily Chart
The Pound Sterling
The Pound Sterling (GBP) is the oldest currency in the world (886 AD) and the official currency of the United Kingdom. It is the fourth most traded currency unit in the world, accounting for 12% of all transactions and an average of $630 billion a day, as of 2022.
Its key currency pairs are GBP/USD, also known as the “Cable,” which accounts for 11% of the forex market, GBP/JPY, or the “Dragon” as it is known to traders (3%), and EUR/GBP (2%). The British Pound is issued by the Bank of England (BoE).
The most important factor influencing the value of the British Pound is the monetary policy decided by the Bank of England. The Bank of England bases its decisions on achieving its main objective of “price stability”, i.e. a stable inflation rate of around 2%. Its main tool for achieving this is the adjustment of interest rates.
When inflation is too high, the Bank of England tries to contain it by raising interest rates, making credit more expensive for individuals and businesses. This is generally positive for the GBP, as higher interest rates make the UK a more attractive place for global investors to park their money.
When inflation is too low, it is a sign that economic growth is slowing. In this scenario, the BoE will consider lowering interest rates to make credit cheaper, so that companies borrow more to invest in growth-generating projects.
The data released gauges the health of the economy and can influence the value of the Pound. Indicators such as GDP, manufacturing and services PMIs, and employment can influence the direction of the Pound.
A strong economy is good for the British Pound. Not only does it attract more foreign investment, but it may encourage the Bank of England to raise interest rates, which will directly strengthen the British Pound. Conversely, if economic data is weak, the British Pound is likely to fall.
Another significant indicator for the pound is the trade balance. This indicator measures the difference between what a country earns from its exports and what it spends on imports during a given period.
If a country produces highly sought-after exports, its currency will benefit exclusively from the additional demand created by foreign buyers who wish to purchase these goods. Therefore, a positive net trade balance strengthens a currency and vice versa for a negative balance.
Pound Sterling PRICE Today
The table below shows the exchange rate of the British Pound (GBP) against major currencies today. The British Pound was the strongest currency against the Japanese Yen.
| USD | EUR | GBP | JPY | CAD | AUD | NZD | CHF | |
|---|---|---|---|---|---|---|---|---|
| USD | 0.08% | 0.09% | 0.32% | 0.03% | 0.05% | 0.04% | -0.01% | |
| EUR | -0.08% | -0.02% | 0.24% | -0.04% | -0.03% | -0.04% | -0.08% | |
| GBP | -0.09% | 0.02% | 0.25% | -0.06% | -0.00% | -0.02% | -0.07% | |
| JPY | -0.32% | -0.24% | -0.25% | -0.31% | -0.28% | -0.29% | -0.33% | |
| CAD | -0.03% | 0.04% | 0.06% | 0.31% | 0.02% | 0.04% | -0.03% | |
| AUD | -0.05% | 0.03% | 0.00% | 0.28% | -0.02% | -0.02% | -0.07% | |
| NZD | -0.04% | 0.04% | 0.02% | 0.29% | -0.04% | 0.02% | -0.04% | |
| CHF | 0.00% | 0.08% | 0.07% | 0.33% | 0.03% | 0.07% | 0.04% |
The heatmap shows percentage changes of major currencies. The base currency is selected from the left column, while the quote currency is selected from the top row. For example, if you choose the British Pound from the left column and move along the horizontal line to the US Dollar, the percentage change shown in the chart will represent the GBP (base)/USD (quote).
Source: Fx Street
I am Joshua Winder, a senior-level journalist and editor at World Stock Market. I specialize in covering news related to the stock market and economic trends. With more than 8 years of experience in this field, I have become an expert in financial reporting.


