
- The silver price regains positive traction on Friday, although it remains in a multi-day range.
- Acceptance above the $21.65-$21.70 confluence supports prospects for further gains.
- A convincing break below the $21.00 level is needed to negate the short-term positive bias.
The price of silver (XAG/USD) moves higher on the last day of the week and maintains its buying tone during the first half of the European session, although it is difficult for it to capitalize on the movement above the $22.00 level.
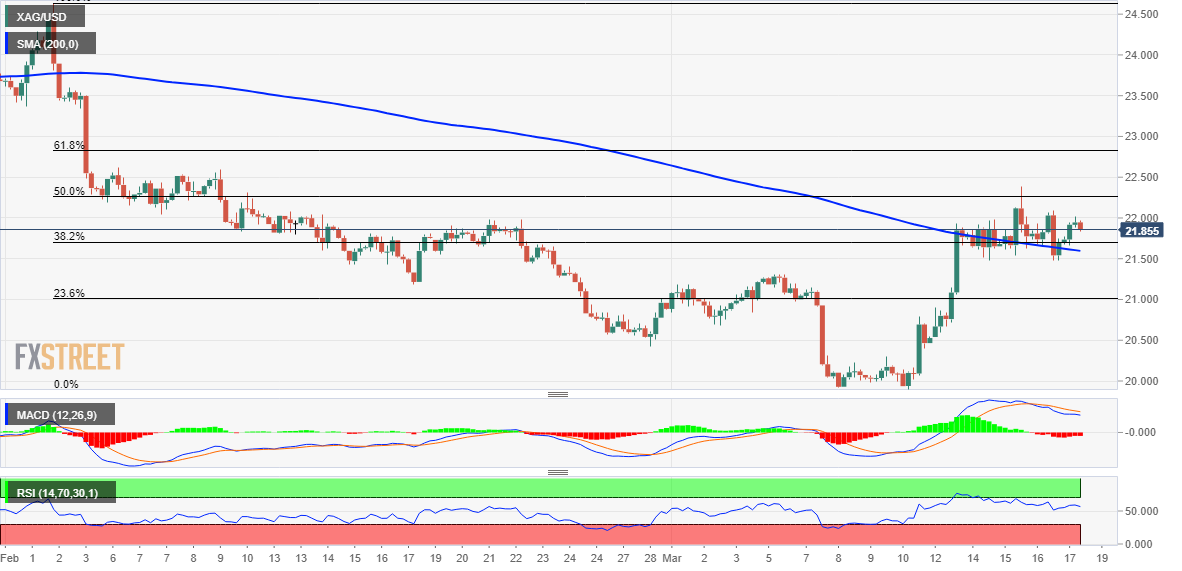
From a technical point of view, the price movements in the two directions in a known range that have been observed in the last few sessions constitute the formation of a rectangle. Against the backdrop of the recent strong recovery from levels below $20.00, or a four-month low hit last week, this could still be classified as a bullish consolidation phase. Furthermore, the acceptance above the $21.65-$21.70 confluence adds credibility to the positive outlook and supports prospects for a further near-term bullish move for XAG/USD.
The mentioned zone comprises the 200 simple moving average (SMA) on the 4-hour chart and the 38.2% Fibonacci retracement of the fall from the $24.65 zone, or a multi-month high hit in February. This should act as a solid base for XAG/USD and help limit the immediate downside. That being said, some continuation selling, leading to a break below the range support near the $21.00 level, could negate the positive outlook and pave the way for a drop towards the $21.00 level.
This last level coincides with the 23.6% Fibonacci, which if broken decisively will change the short-term trend in favor of bears. Then, XAG/USD could become vulnerable and accelerate the decline towards the intermediate support of $20.55-$20.50, on the way to the psychological level of $20.00. The bearish trajectory could extend further and drag XAG/USD to the next relevant support near the $19.60 area. The white metal could go as far as the $19.00 level for the first time since early November 2022.
On the other hand, a push back above the $22.00 round level could face stiff resistance near the $22.25-$22.35 zone, the 50% Fibonacci and the previous day’s high. The ensuing move higher could push XAG/USD beyond the $22.55-$22.60 zone, towards testing the 61.8% Fibonacci just ahead of the $23.00 level. Sustained strength above this last level will be seen as a new trigger for the bulls and should pave the way for a significant rally in the white metal in the short term.
Silver 4 hour chart
Silver additional technical levels
Source: Fx Street
I am Joshua Winder, a senior-level journalist and editor at World Stock Market. I specialize in covering news related to the stock market and economic trends. With more than 8 years of experience in this field, I have become an expert in financial reporting.


