
- Silver comes under some selling pressure on Friday, although the fall remains supported.
- The technical setup supports the possibility of some buying at lower levels.
- A sustained break below trend line support will negate the positive outlook.
Silver (XAG/USD) is moving lower on Friday and moving away from a 1-week high around the $21.65 to $21.70 zone that was hit on Thursday. The white metal remains on the defensive during the European session and currently sits just below $21.00.
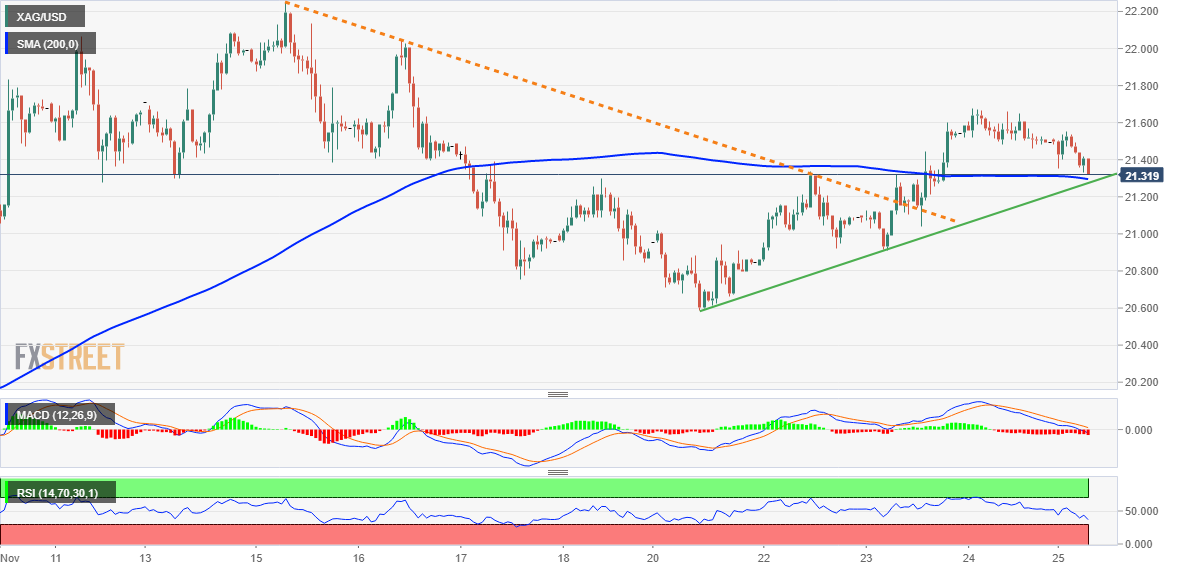
From a technical point of view, XAG/USD has, so far, managed to defend the 200 hour SMA. Against the backdrop of a convincing break above a week-long descending resistance line (orange) on Wednesday, the setup favors the bulls and supports prospects for further appreciation in the near term.
This constructive outlook is reinforced by the fact that the oscillators on the daily chart remain in bullish territory. However, the technical indicators on the 1 hour chart have just started to gain negative traction and warrant some caution amid relatively poor liquidity conditions in the markets.
However, XAG/USD looks set to break above the previous day’s high, around the $21.65-$21.70 area, and recapture the $22.00 level. This is followed by a five-month high around the $22.25 area, above which XAG/USD could rally to the $22.50-$22.60 area en route to the round $23.00 level.
On the other hand, the $21.00 level could act as immediate support before a rising trend line support, currently around the $20.80 area. A convincing break below this last level could nullify the positive outlook and possibly shift the short-term bias in favor of the bears.
XAG/USD could then accelerate the decline to the $20.60 to $20.55 zone (weekly low) before finally falling to challenge the psychological $20.00 level. Some continuation selling could expose the $19.00 level, with intermediate support near the $19.65 to $19.60 region.
Silver 1 hour chart
silver key levels
Source: Fx Street
I am Joshua Winder, a senior-level journalist and editor at World Stock Market. I specialize in covering news related to the stock market and economic trends. With more than 8 years of experience in this field, I have become an expert in financial reporting.


