
- The price of Silver recovers from an intraday drop and returns to close to its yearly high on Tuesday.
- The technical situation favors the bulls and supports the prospects for further increases.
- Sustained weakness below the $23.00 level will nullify the positive outlook.
The price of Silver (XAG/USD) attracts some buying near the $23.65-$23.60 area on Tuesday and flirts with the yearly high during the first half of the European session. The white metal is currently trading just below the $24.00 level and looking to build on the previous day's breakout momentum above the $23.30-$23.35 confluence barrier.
This last level comprises the 100-day and 200-day SMA, which should now act as a key point for XAG/USD. Any significant corrective slide is most likely to be bought near said resistance-turned-support and remain capped near the $23.00 round level. That said, some continuation selling will suggest that the strong week-long move has run out of steam and pave the way for deeper losses.
XAG/USD could accelerate its decline towards the intermediate support of $22.50-$22.45 before falling to levels below $22.00 or the two-month low it hit in January and retested in February. The bearish trajectory could extend further and drag the white metal towards the next relevant support near the $21.40-$21.35 area. However, positive oscillators on the daily chart advise caution for bears.
On the other hand, the momentum above the $24.00 level is likely to face some resistance near the $24.30-$24.35 region before the $24.50 resistance zone. Sustained strength above that region should allow 2023.
Daily Silver Price Chart
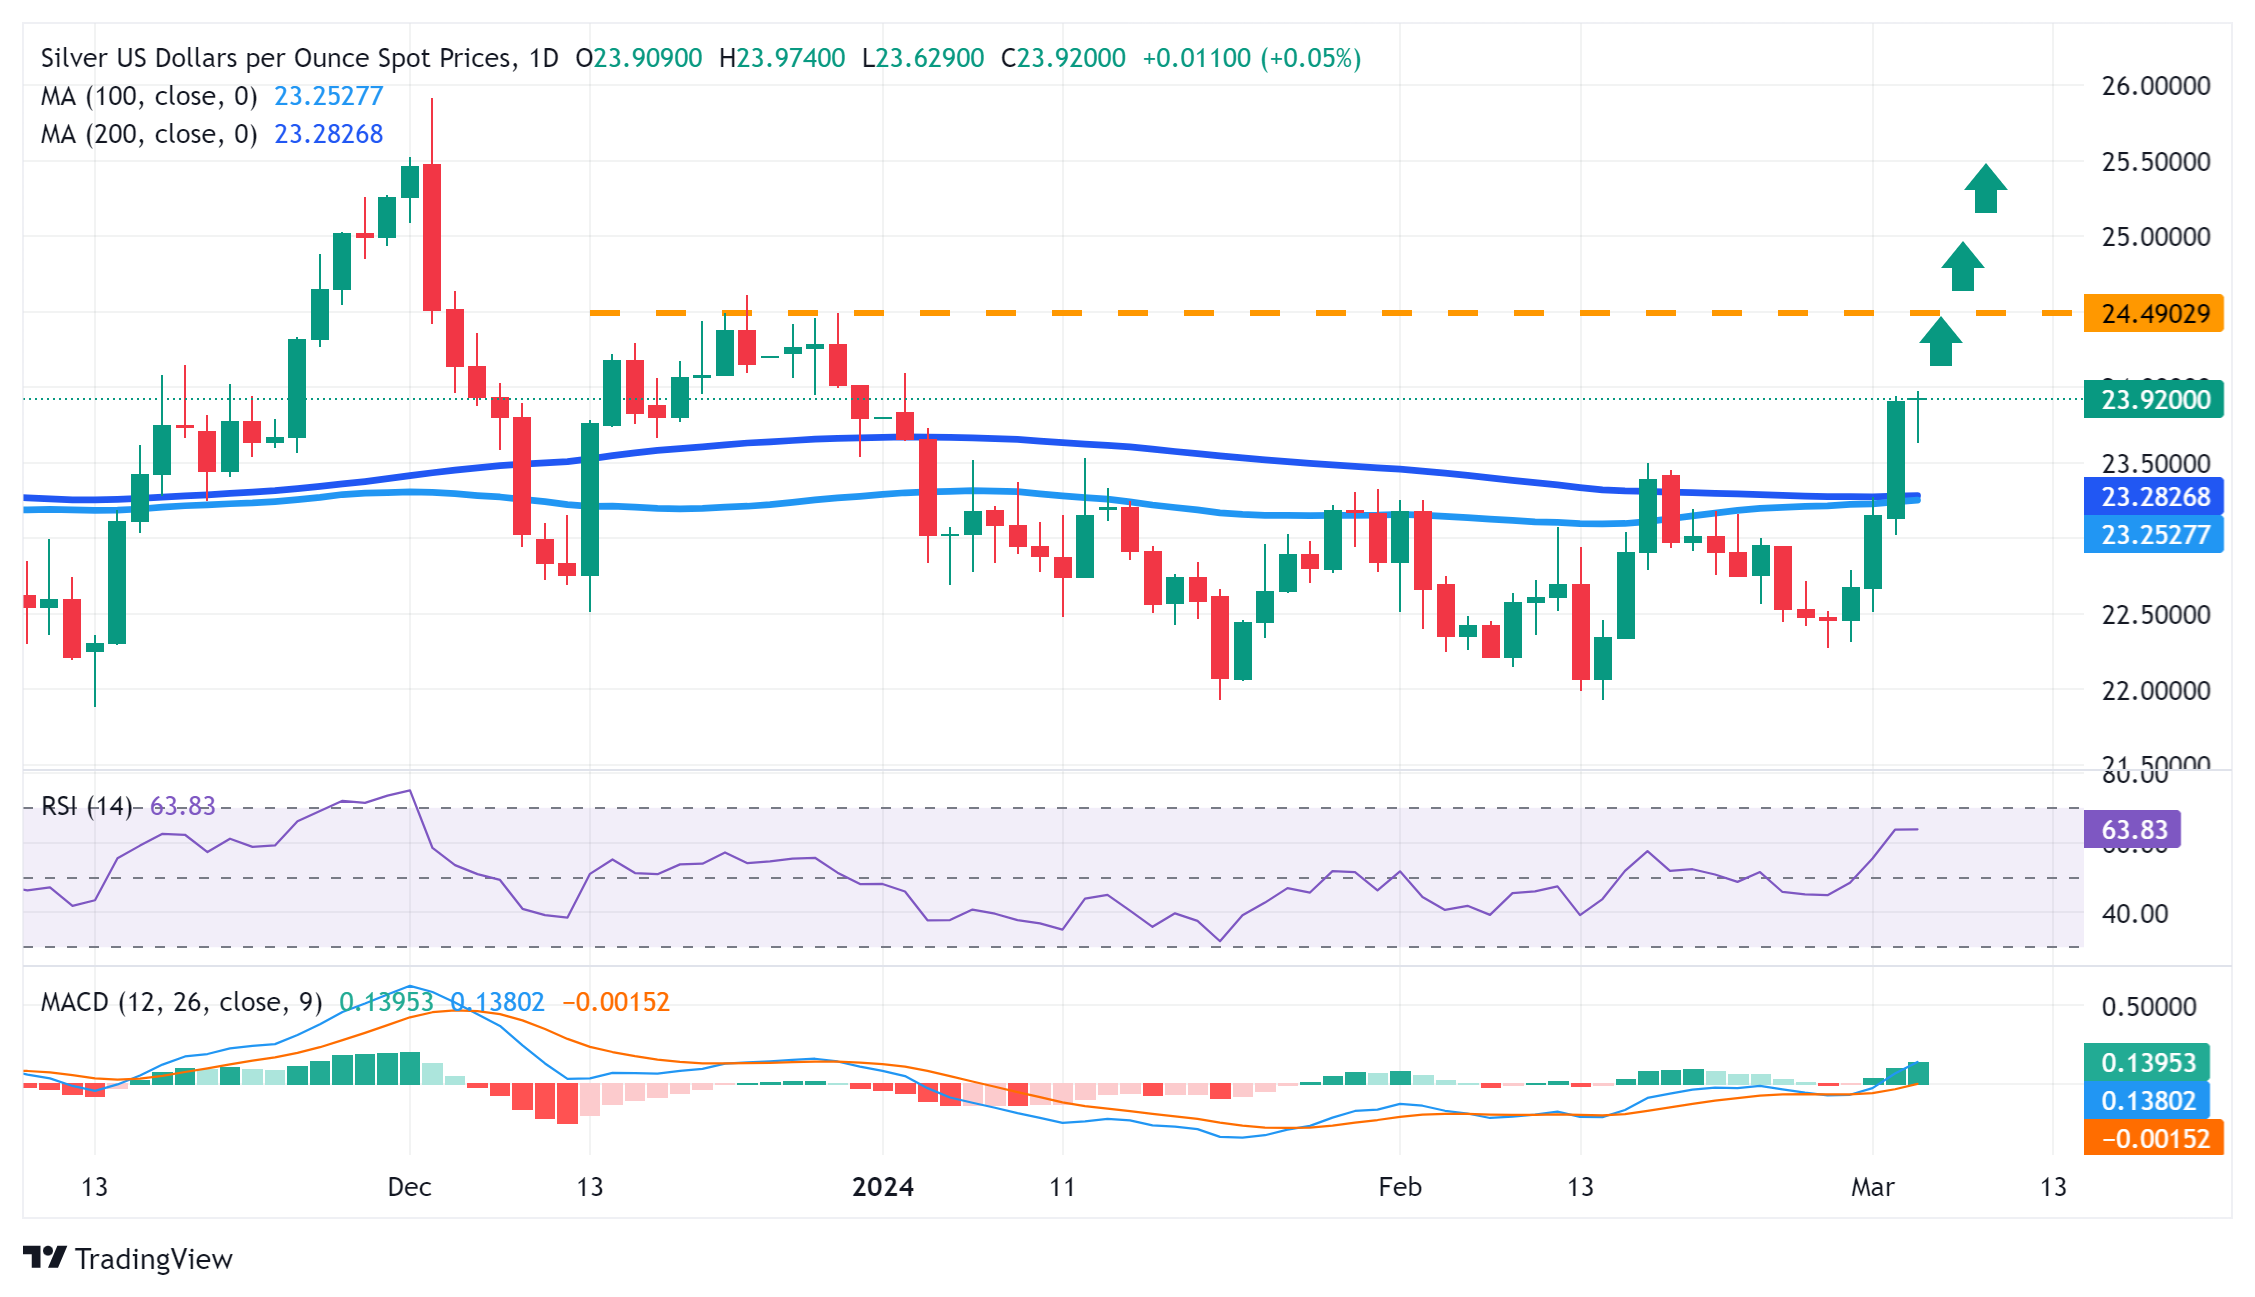
Source: Fx Street
I am Joshua Winder, a senior-level journalist and editor at World Stock Market. I specialize in covering news related to the stock market and economic trends. With more than 8 years of experience in this field, I have become an expert in financial reporting.


