
- Silver price drops vertically below $30.00 as US yields soar following upbeat US NFP report for May.
- Both job and wage growth exceed estimates.
- The pause in the PBoC’s purchasing of Gold also weighed on the price of Silver.
The price of Silver (XAG/USD) plummets below the psychological support of $30.00 in the American session on Friday. The white metal slumps after the US Nonfarm Payrolls (NFP) report for May showed labor demand remains robust and wage growth momentum was stronger than expected.
New payrolls stood at 272,000, exceeding expectations of 185,000 and the previous release of 165,000. Average hourly earnings rose sharply by 0.4% from estimates of 0.3% and the previous release of 0.2% on a monthly basis. Average Hourly Earnings data is a measure of wage inflation, which drives household spending. The annual measure of wage inflation rose 4.1%, beating the estimate of 3.9% and April’s reading of 4.0%.
Strong payroll and wage growth data drive the need to maintain a restrictive interest rate framework by the Federal Reserve (Fed) for a longer period, which is a favorable situation for interest-bearing asset yields and the US dollar. US 10-year Treasury yields rise 4.43%, up 3.5% from Thursday’s close. The US Dollar Index (DXY), which tracks the value of the Dollar against six major currencies, jumps to 104.80. Rising yields on interest-bearing assets increase the opportunity cost of maintaining an investment in non-yielding assets, such as Silver.
The white metal was already under pressure as the People’s Bank of China (PBoC) gold reserves report for May showed its 18-month gold buying streak halted for a while. The report showed that gold reserves remained unchanged at 72.80 million fine troy ounces.
Silver technical analysis
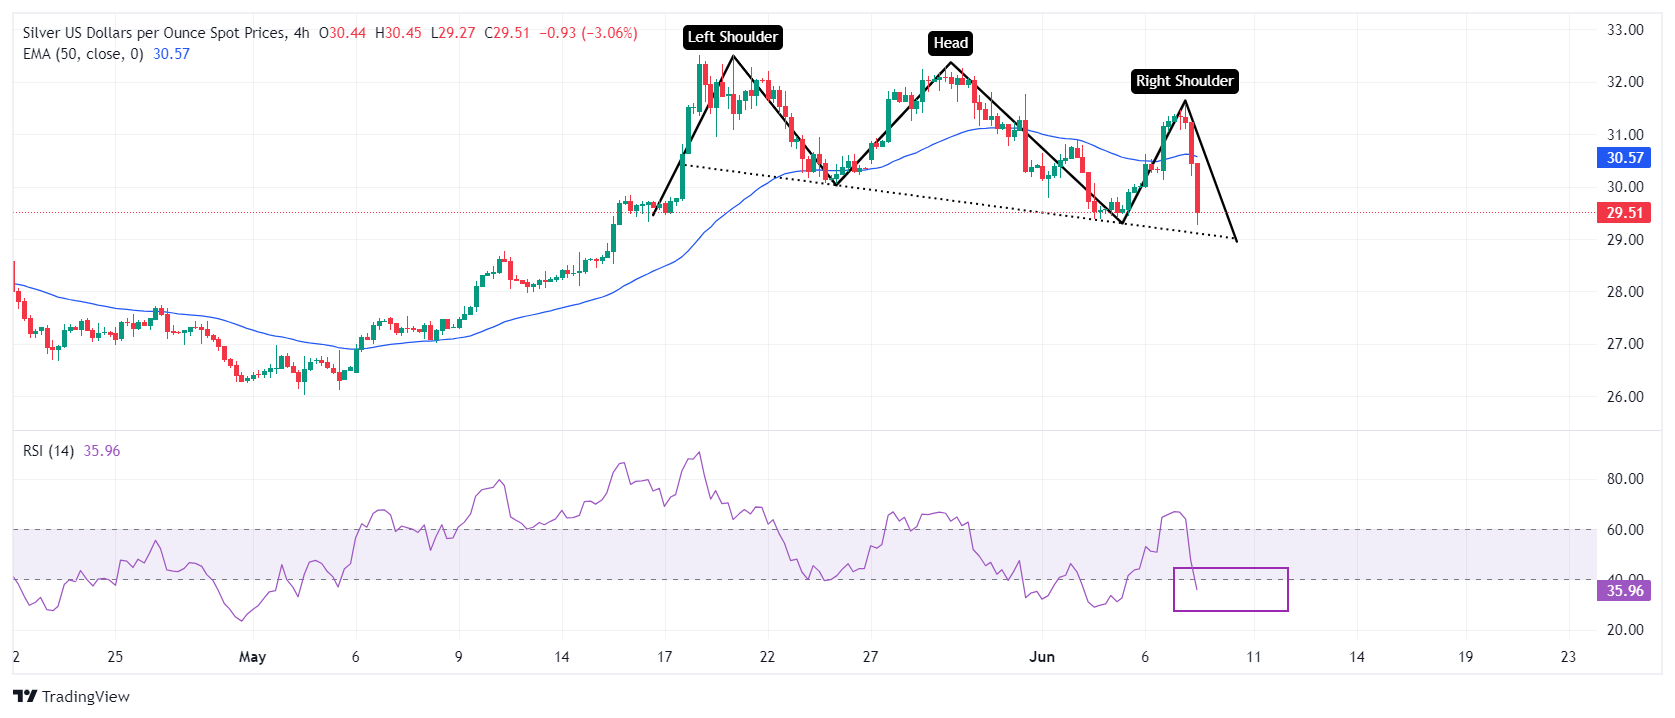
The selling pressure on the Silver price indicates that a downward breakout of the head-shoulders chart pattern formed on a four-hour time frame could occur. The neck line of the mentioned chart pattern appears to be around $29.00. A decisive break below it would result in a bearish reversal.
Silver prices have fallen below the 50-period EMA near $30.50, suggesting that the near-term outlook turns bearish.
The 14-period RSI has fallen below 40.00. A sustained move below it will push the momentum downwards.
Silver Four Hour Chart
Source: Fx Street
I am Joshua Winder, a senior-level journalist and editor at World Stock Market. I specialize in covering news related to the stock market and economic trends. With more than 8 years of experience in this field, I have become an expert in financial reporting.


