
- The price of Silver falls to lows in more than a week on Wednesday, although it finds some support at lower levels.
- The technical situation continues to favor the bears and supports the prospects of a new decline.
- The stage seems set to retest the support of an ascending trend line, near the $22.35 area.
The price of Silver (XAG/USD) falls for the third consecutive day and registers lows around $22.65 during the first hours of the European session on Wednesday. The white metal, however, manages to recover a little in the last hour and is currently trading around the $2.80-$22.75 zone, with a drop of around 0.30% on the day.
From a technical point of view, the previous day’s sustained breakout and close below the round $23.00 level was considered a new trigger for the bears. Furthermore, the oscillators on the daily chart have once again gained negative traction and support the prospects of a further depreciating move for XAG/USD. Therefore, a subsequent pullback towards challenging an ascending trend line extending from the June monthly low, currently around the $22.35 area, seems a clear possibility.
A convincing break below this last level would confirm a new breakout and expose the next relevant support, near $22.00. Continued sales would set the stage for further losses. XAG/USD could then accelerate the bearish trajectory towards the intermediate support at $21.25 before finally falling to the round $21.00 level.
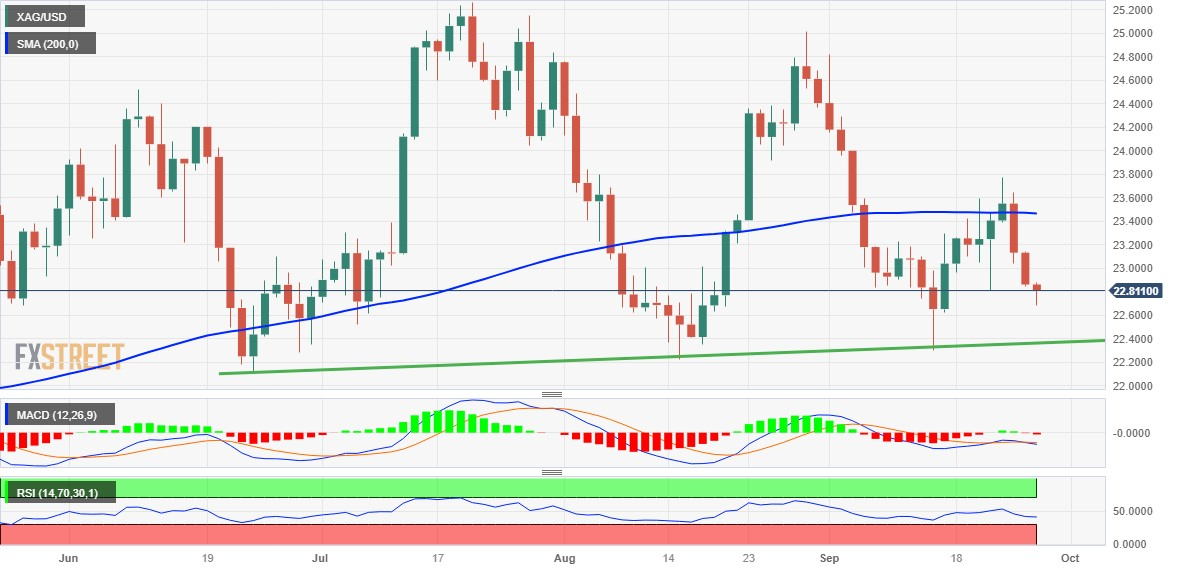
On the other hand, the $23.00 level could now act as an immediate hurdle ahead of the $23.20-$23.25 area and the important 200-day SMA, currently around the $23.45 region. Below is last week’s high, around $23.75. Sustained strength above that region has the potential to lift of $25.00.
Daily Silver Price Chart
Silver additional technical levels
Source: Fx Street
I am Joshua Winder, a senior-level journalist and editor at World Stock Market. I specialize in covering news related to the stock market and economic trends. With more than 8 years of experience in this field, I have become an expert in financial reporting.


