
- Silver price upside remains limited around $31.00 with focus on US inflation
- The US dollar remains on the defensive amid strong bets on a Fed rate cut.
- Fed’s Powell sees cracks in US labor market strength
Silver (XAG/USD) price is consolidating in a narrow range for the past four trading sessions. The upside in the silver price remains limited to around $31.00 as investors await the United States (US) Consumer Price Index (CPI) data for June, due out at 12:30 GMT.
Inflation data will significantly influence market speculation about Federal Reserve (Fed) rate cuts this year. According to the CME FedWatch tool, traders expect the central bank to choose the September meeting as the earliest point to pivot toward policy normalization. The tool also shows that there will be two rate cuts instead of one, as officials noted in the latest dot plot.
Meanwhile, the US CPI report is expected to show that core inflation, which excludes volatile food and energy prices, rose steadily, while the annual headline figure eased to 3.1% from May’s reading of 3.3%.
Market expectations for Fed rate cuts strengthened due to growing cracks in the US labor market due to the maintenance of a restrictive interest rate stance. In semi-annual testimony before Congress, Fed Chairman Jerome Powell admitted that the economy is no longer overheated, with labor market conditions cooling. He added that the labor market has moderated to where it was before the pandemic era.
Strong speculation of rate cuts is weighing on the US Dollar (USD). The US Dollar Index (DXY), which tracks the value of the Greenback against six major currencies, looks vulnerable near a four-week low around 104.85
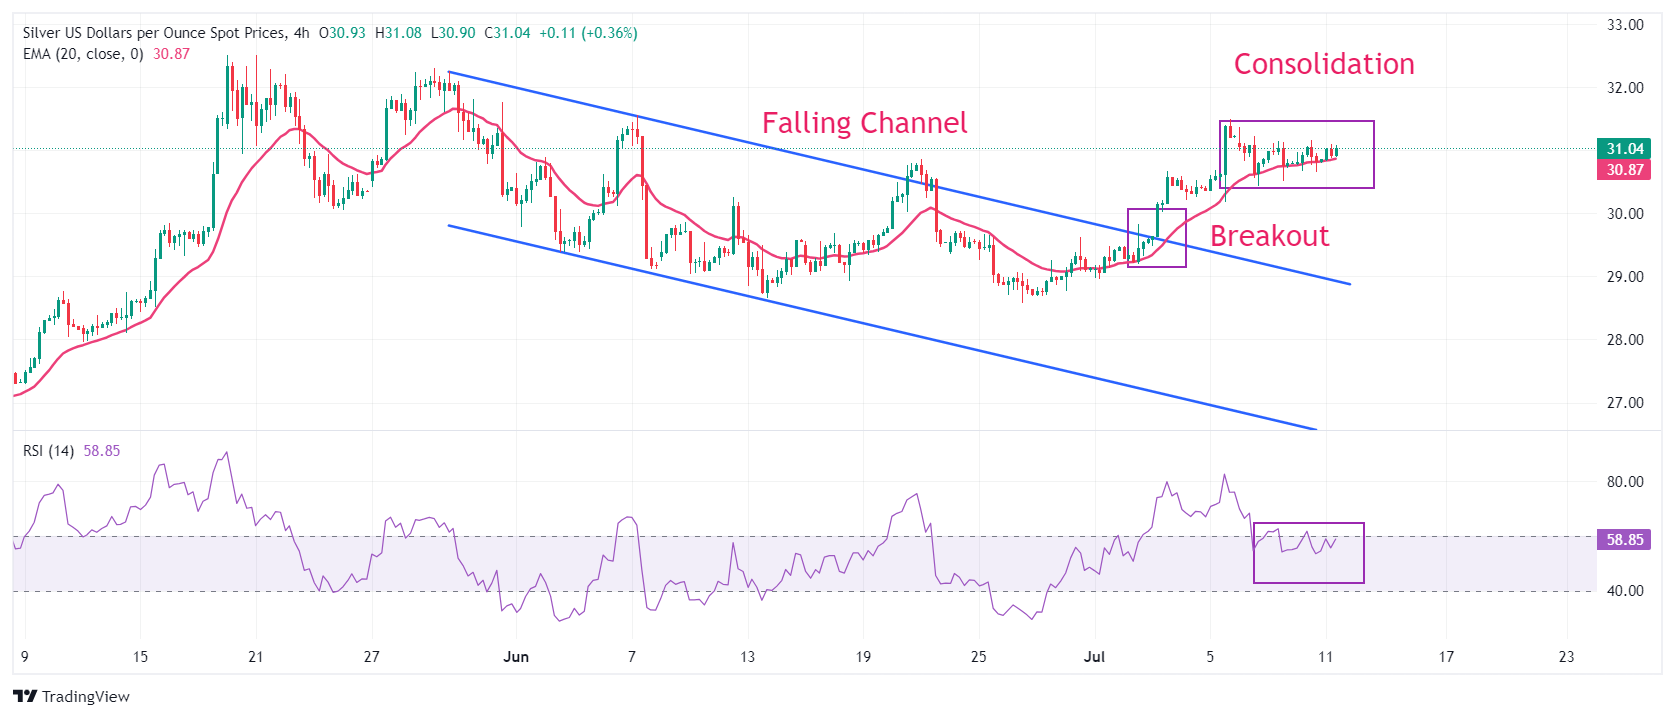
Technical analysis of Silver
Silver price is trading sideways in a tight range around $31.00, suggesting a sharp contraction in volatility. The overall trend remains bullish as it has turned sideways after a decisive breakout of the Bullish Flag chart formation on a four-hour time frame. The asset is trading near the 20-period exponential moving average (EMA) near $31.00, suggesting indecision ahead of the US inflation data.
The 14-period Relative Strength Index (RSI) is hovering near 60.00. A decisive break above it would push the momentum higher.
Silver four-hour chart
Economic indicator
Consumer Price Index (YoY)
The CPI is published on US Labor Department and measures price movements by comparing retail prices of a representative basket of goods and services. The purchasing power of the dollar is diminished by inflation. The CPI is a key indicator for measuring inflation and purchasing trends. A reading above expectations is bullish for the dollar, while a reading below expectations is bearish.
Next post:
Thu Jul 11, 2024 12:30 PM
Frequency:
Monthly
Dear:
3.1%
Previous:
3.3%
Fountain:
US Bureau of Labor Statistics
The US Federal Reserve has a dual mandate of maintaining price stability and maximum employment. According to this mandate, inflation should be around 2% YoY and has become the weakest pillar of the central bank’s directive ever since the world suffered a pandemic, which extends to these days. Price pressures continue to rise amid supply-chain issues and bottlenecks, with the Consumer Price Index (CPI) hanging at multi-decade highs. The Fed has already taken measures to tame inflation and is expected to maintain an aggressive stance in the foreseeable future.
Source: Fx Street
I am Joshua Winder, a senior-level journalist and editor at World Stock Market. I specialize in covering news related to the stock market and economic trends. With more than 8 years of experience in this field, I have become an expert in financial reporting.


