
- Silver rises 1.32% to $28.57, driven by lower US Treasury yields and the weakening Dollar.
- The XAG/USD pair is showing a strong bullish trend within the range of $28.00 to $28.80, from the low of $26.02 recorded in early May.
- To maintain the momentum, Silver aims to break above $29.00, aiming for yearly highs of $29.79 and $30.00.
- Support is seen at $28.00; additional supports at 38.2% Fibonacci ($27.70) and 50% Fibonacci ($27.06).
The price of Silver rose late in the North American session due to the decline in US Treasury yields and the weakening of the US Dollar. Although the latest US inflation figures were higher than expected, the non-yielding metal rose. XAG/USD is trading at $28.57, with a gain of 1.32%.
XAG/USD Price Analysis: Technical Outlook
For the past three days, Silver has been oscillating within the $28.00-$28.80 range after posting exponential gains since May 2, taking the price of the gray metal from around $26.02 to current spot prices.
XAG/USD is in an uptrend, although it is about to form a “double top.” Momentum favors buyers, with the RSI in bullish territory.
For a bullish continuation, buyers need to recover the psychological figure of $29.00. Once surpassed, the next stop would be the yearly high at $29.79, followed by $30.00.
On the contrary, if sellers intervene and push prices below $28.00, further losses will have to be expected. The first demand zone would be the 38.2% Fibonacci retracement at $27.70. A break of the latter will expose the 50% Fibonacci retracement at $27.06.
XAG/USD Price Action – Daily Chart
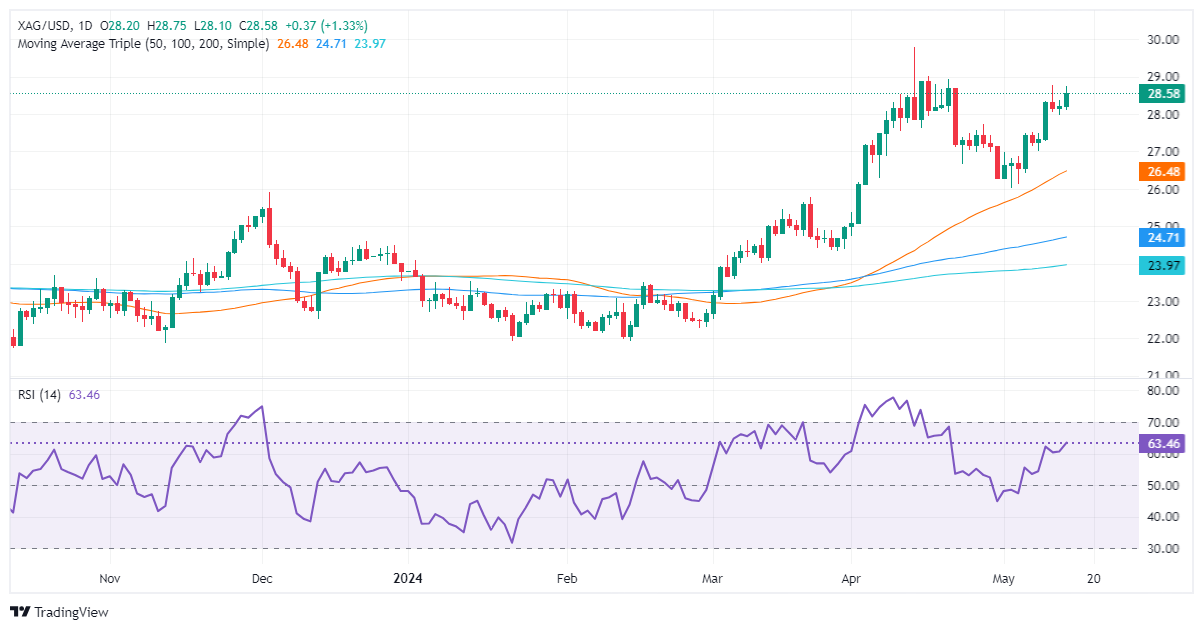
Source: Fx Street
I am Joshua Winder, a senior-level journalist and editor at World Stock Market. I specialize in covering news related to the stock market and economic trends. With more than 8 years of experience in this field, I have become an expert in financial reporting.


