
- Silver rose strongly, more than 1.60%, as liquidity conditions improved.
- The strong dollar was no excuse for XAG/USD posting solid gains, driven by falling US bond yields.
- The S&P Global Manufacturing PMI for the US was unchanged, despite the ongoing economic slowdown.
- Silver Price Analysis: Maintain upside bias above $24.29.
the price of silver rallies strongly regardless of US dollar strength, although falling US Treasury yields supported the white metal. Wall Street is preparing for a higher open, despite the fact that China’s PMIs showed that factory activity eased, and its reopening improved the sentiment of traders. At the time of writing, XAG/USD is trading at $24.35 per troy ounce.
Sentiment is upbeat as shown by US stock futures pointing to a higher open. Release over the weekend from China’s PMI showed manufacturing activity slowed amid the Covid-19 lockdowns imposed in December. However, the relaxation of China’s zero-tolerance policy was applauded by investors in early 2023.
Meanwhile, the Dollar Index (DXY), a gauge of the dollar’s value against a basket of currencies, posts solid gains of 0.81% to 104.326, without weighing on precious metal prices. US Treasury Yields started the year on the wrong foot, as the 10-year Treasury yield is falling eight and a half points to 3.746%, as traders began to return to value a dovish Federal Reserve (Fed) in 2023.
Another factor weighing on precious metal prices is falling US Real Yields, as shown by the US 10-year TIPS yield falling 12bp to 1,471%, compared to last week’s close of 1,473%.
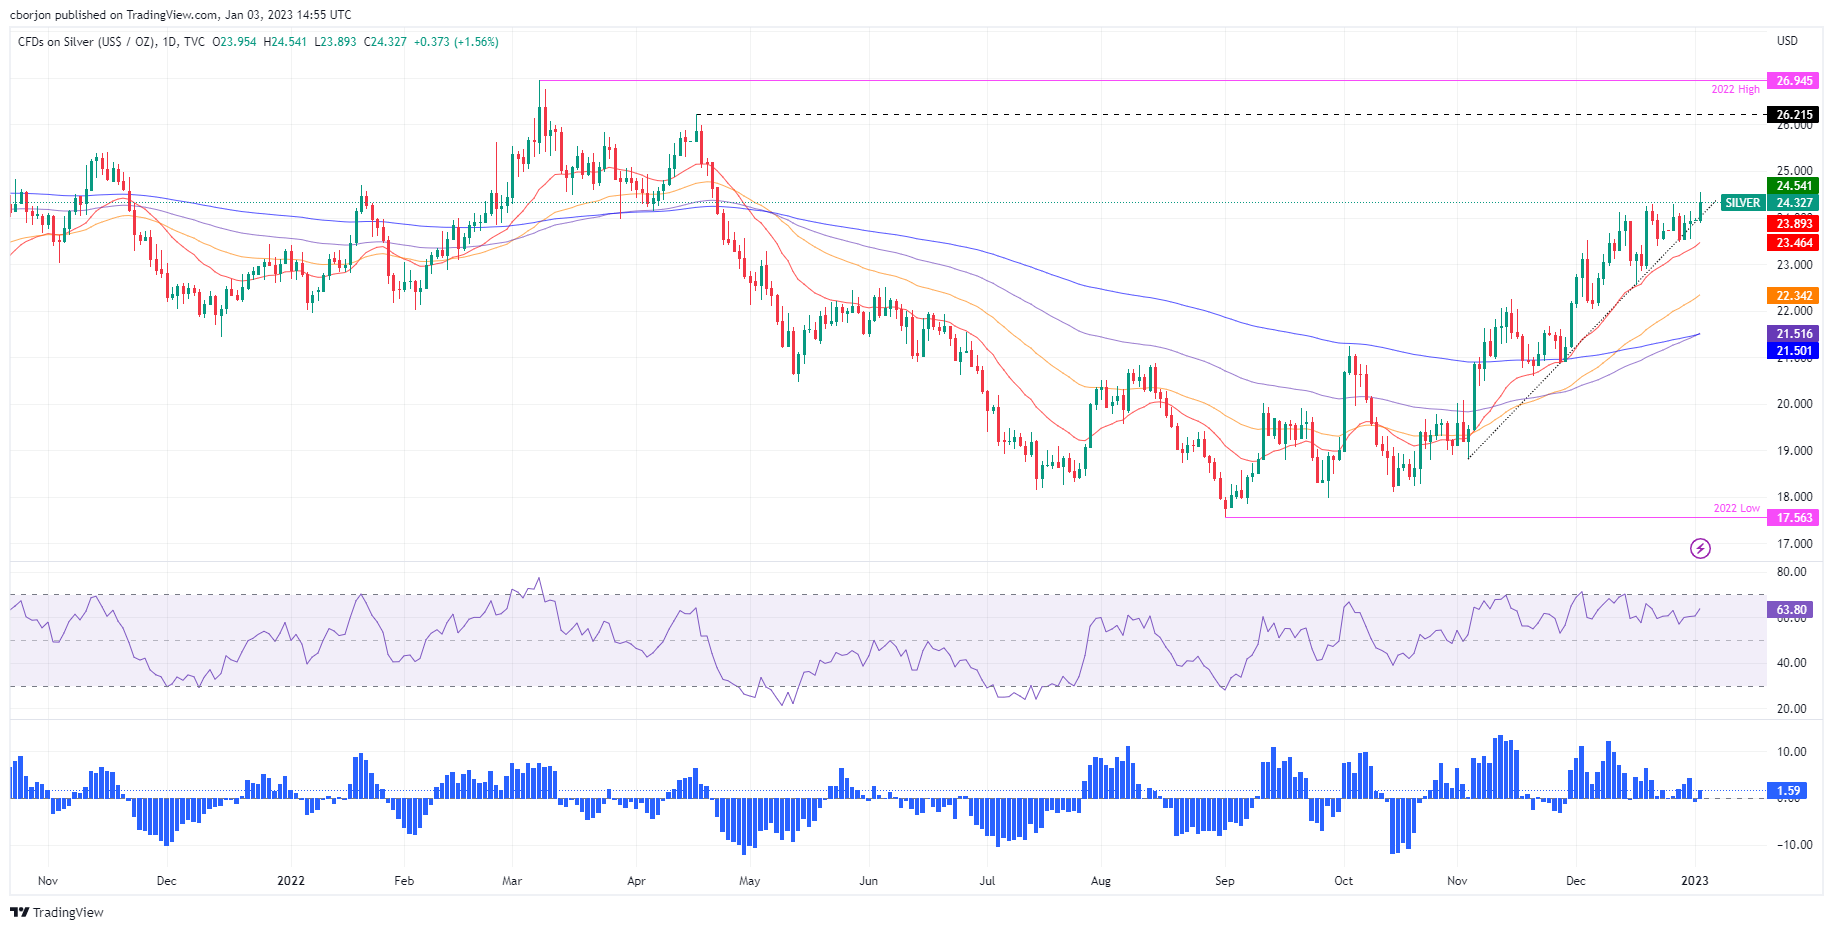
XAG/USD continued its bullish trend after hitting a daily low of $23.89 after a flat Monday session. A daily close above the December monthly high of $24.29 could pave the way for a new trading range within the $24.29-$26.21 range.
At the time of the report’s publication, the global US manufacturing PMI for the month of December stood at 46.2 points. Report that factory activity was weaker through 2022, triggered by a contraction in production, new orders, and muted demand conditions.
Silver Price Analysis: XAG/USD Technical Outlook
The daily chart of the XAG/USD shows the white metal with a bullish bias. The Relative Strength Index (RSI) is comfortably in bullish territory near Overbought Conditions, while the Rate of Change (RoC) suggests that buying pressure is starting to build. In addition, XAG/USD is supported by a two-month uptrend line and the 20-day EMA around $23.47, which has been tracking silver since mid-November. . Therefore, the XAG/USD is expected to continue to rise.
The first resistance of the XAG/USD would be at $24.50. Break above will expose the $25.00 figure, followed by the April 18 daily high at $26.21.
Source: Fx Street
I am Joshua Winder, a senior-level journalist and editor at World Stock Market. I specialize in covering news related to the stock market and economic trends. With more than 8 years of experience in this field, I have become an expert in financial reporting.


