
- The Loonie’s advance benefited from a soft US dollar and high oil prices.
- Statistics Canada reported that consumer prices hit a 31-year high, up 6.8% year-on-year.
- USD/CAD Price Forecast: Hit 1.2700 once USD/CAD bears retrace 1.2800.
The USD/CAD falls for the third day of the week and trades back below the 1.2900 figure after two consecutive days of a very busy Canadian calendar, in which inflation figures were released, which showed consumer prices rising. However, the market reacted in the opposite way, sending the USD/CAD higher above 1.2900, although Thursday is a different story. At 1.2801, the Loonie regained its strength, although the greenback is trading softer in the American session.
Canadian inflation at 31-year high
On Wednesday, Canadian data showed inflation hit a 31-year high at a pace of 6.8% year-on-year, higher than the 6.7% expected. Analysts at TD Securities wrote in a note that the report could keep the Bank of Canada under pressure to move policy to neutral. They added that while “the Bank has already acknowledged that further hikes of 50 basis points are likely, today’s report is unlikely to tip the scales towards a 75 basis point hike.”
“We continue to expect the Bank to hike 50bps in June and July to bring the overnight rate to 2.00%, before moving to 25bps hikes from September-January,” TD Securities analysts noted.
Meanwhile, on Thursday, Statistics Canada reported that prices paid by producers, also known as PPIs, were in line with expectations, but commodities soared to 38.4% year-on-year, above estimates of 31% .
Coupled with a weaker US dollar despite a risk-off environment, these factors are a headwind for USD/CAD. In addition, the rise in US crude, with WTI gaining almost 1.50% to $110.79 a barrel, boosted the Canadian dollar outlook.
The initial applications for unemployment benefits for the week ending May 14 were published on the economic calendar in the United States, which grew by 218,000, above the estimated 200,000. At the same time, the Philadelphia Fed manufacturing index rose to 2.6, well below the 17.6 estimate, after the New York Fed’s Empire State Index fell to 11.6, which painted a disappointing figure. of the US ISM for June.
During the day, the president of the Kansas City Fed, Esther George, affirmed that the “tough week in the stock markets” does not alter her support for increases of 50 basis points to cool inflation. She added that “right now, inflation is too high, and we will have to make a series of rate adjustments to bring it down.”
On Wednesday, Philadelphia Fed President Patrick Harker declared that the Fed “doesn’t want to overdo it” and commented that the US could have a few quarters of negative growth, but that is not what he forecasts.
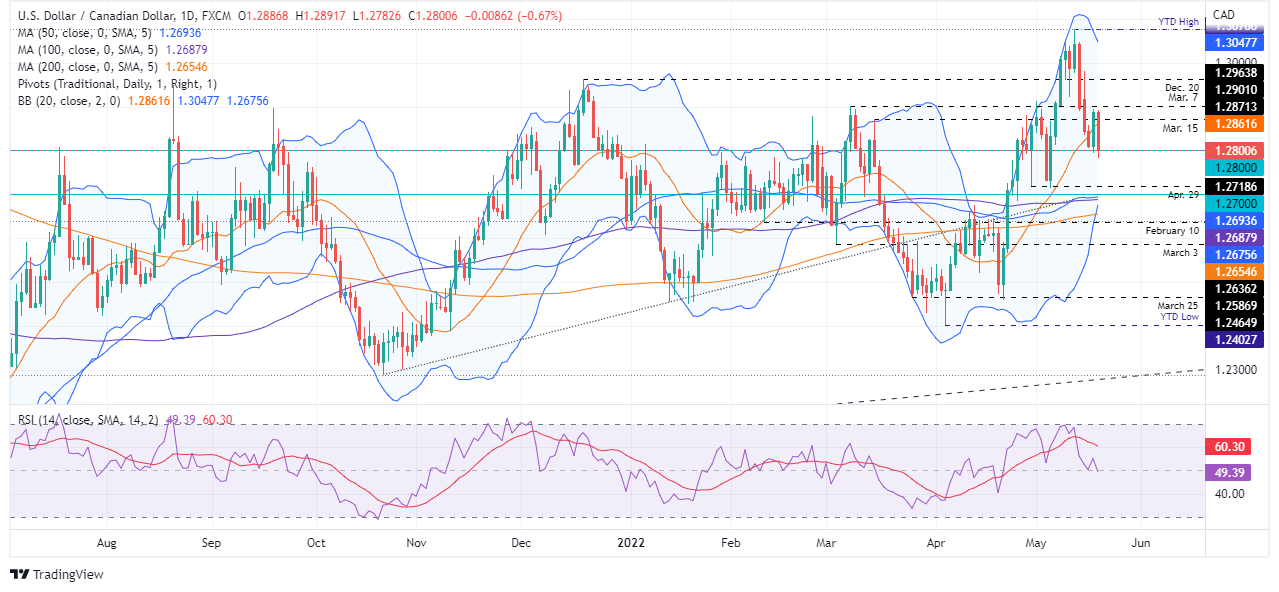
USD/CAD Price Forecast: Technical Outlook
USD/CAD fell below the 20-day moving average (DMA) at 1.2861 on Thursday, indicating that bears remain in control in the short term. It is worth noting the slope of the 50, 100 and 200 DMAs, trapped in the 1.2693-54 zone, almost horizontal, which accentuates the sideways price action of the major. Digging a little deeper, the RSI is about to cross into negative territory, winding around 50, but sloping downwards, opening the door for further losses.
That said, the first support for the USD/CAD would be 1.2800. Once cleared, the next demand zone would be the daily low on April 29 at 1.2718, followed by the confluence of the 50 and 100 DMAs at 1.26693 and 1.2688, respectively.
Technical levels
Source: Fx Street
With 6 years of experience, I bring to the table captivating and informative writing in the world news category. My expertise covers a range of industries, including tourism, technology, forex and stocks. From brief social media posts to in-depth articles, I am dedicated to creating compelling content for various platforms.


