
- US dollar recovers on risk aversion, spurred by China’s COVID-19 crisis.
- USD/CAD bounced from the lows around 1.3300 and tested the 1.3400 level.
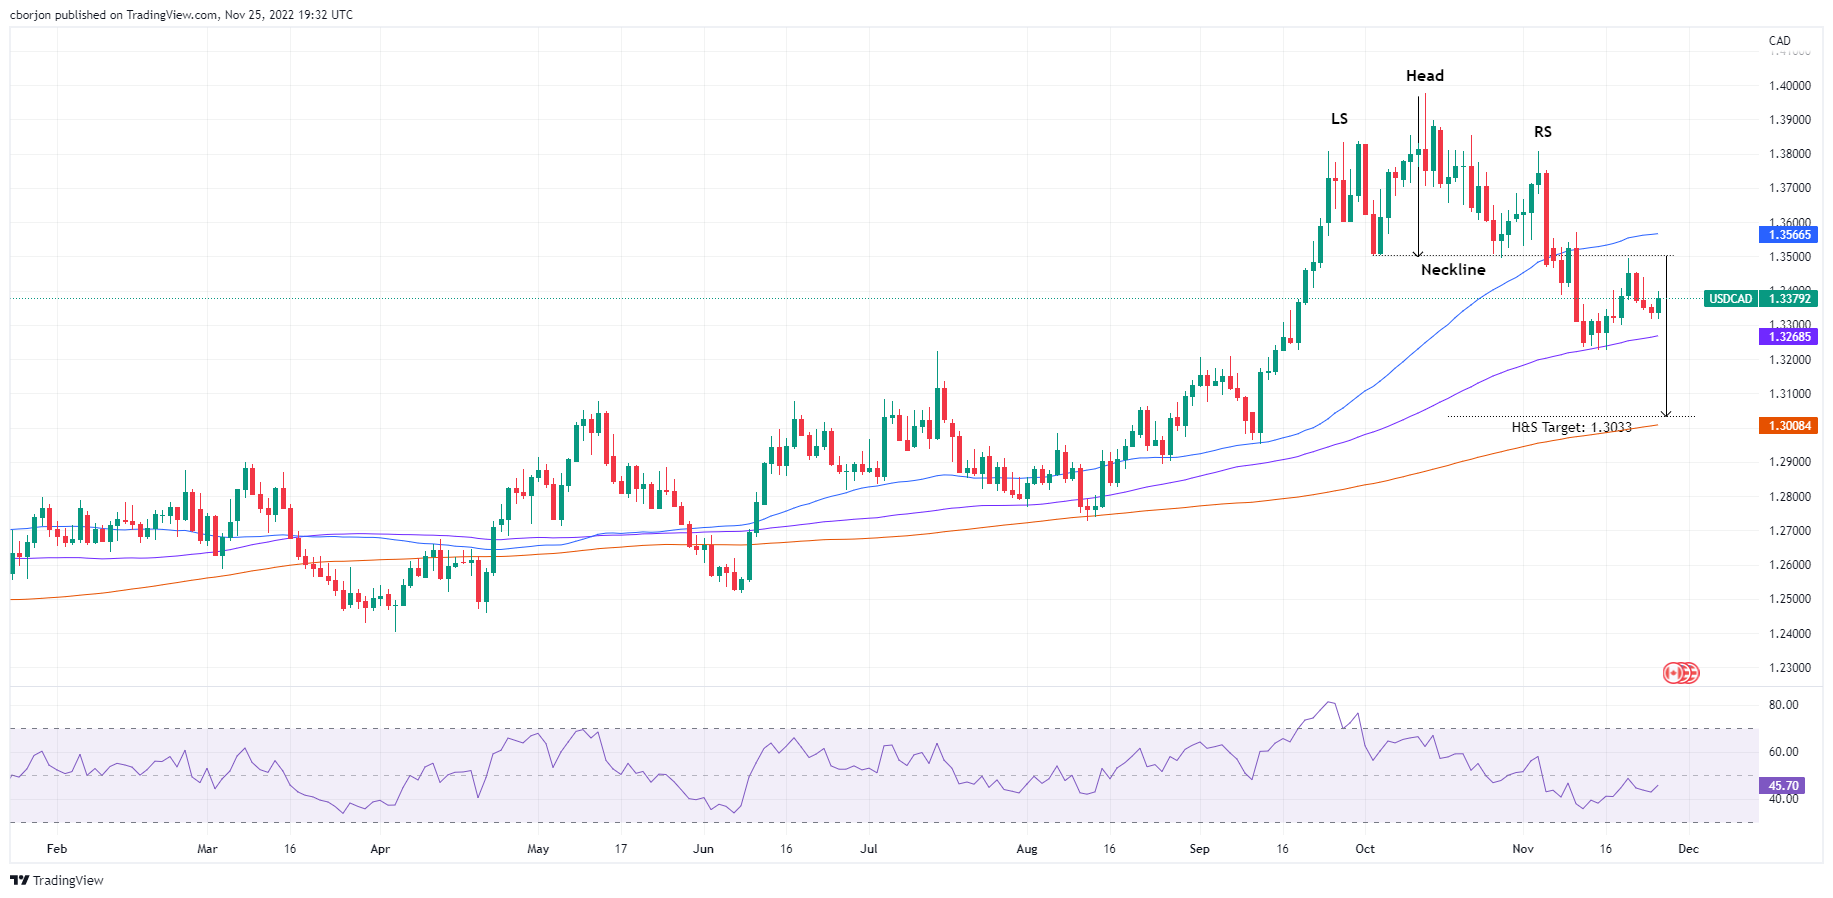
- USD/CAD Price Analysis: The head and shoulders chart pattern remains intact.
The US dollar (USD) recovers front to the Canadian dollar (CAD) in the middle of a subdued trading session, triggered by tight liquidity conditions caused by the US Thanksgiving holiday. However, China’s Covid-19 cases jumped above 30,000, spurring a risk-off momentum, and US Treasury yields rose, supporting the dollar. At the time of writing, USD/CAD is trading at 1.3376.
USD/CAD Price Analysis: Technical Perspective
On the daily chart of USD/CAD, the major currency erased Thursday’s losses, but failed to break above 1.3400 after hitting a daily high of 1.3398. Although the dollar is rising, traders should be aware that the head and shoulders chart pattern is still in play. However, USD/CAD needs to break below 1.3300 and the 100 day EMA at 1.3268 to compound the slide towards the head and shoulders chart pattern. Otherwise, USD/CAD could break above the 1.3500 neckline and invalidate the pattern.
As an alternative scenario, the first resistance of the USD/CAD would be the figure of 1.3400. A break of the latter will send USD/CAD to the confluence of the head and shoulders neckline and the 1.3500 psychological level, followed by the 50-day EMA at 1.3566.
Key USD/CAD Technical Levels
Source: Fx Street
I am Joshua Winder, a senior-level journalist and editor at World Stock Market. I specialize in covering news related to the stock market and economic trends. With more than 8 years of experience in this field, I have become an expert in financial reporting.


