
- USD/CAD is likely starting a fresh bullish range-bound extension.
- The MACD has crossed above its signal line, adding further credence to the bullish thesis.
- A mini bullish pennant may also have formed at the lows of the range.
He USD/CAD has been trading in a range since early May. At first it seemed that the pair had formed a symmetrical triangle pattern, but the pattern failed to evolve.
The pair’s lack of directionality means that the short-term trend is now likely to be sideways. Since the “trend is your friend”, the odds favor a continuation of the USD/CAD’s sideways swings.
USD/CAD 4-hour chart
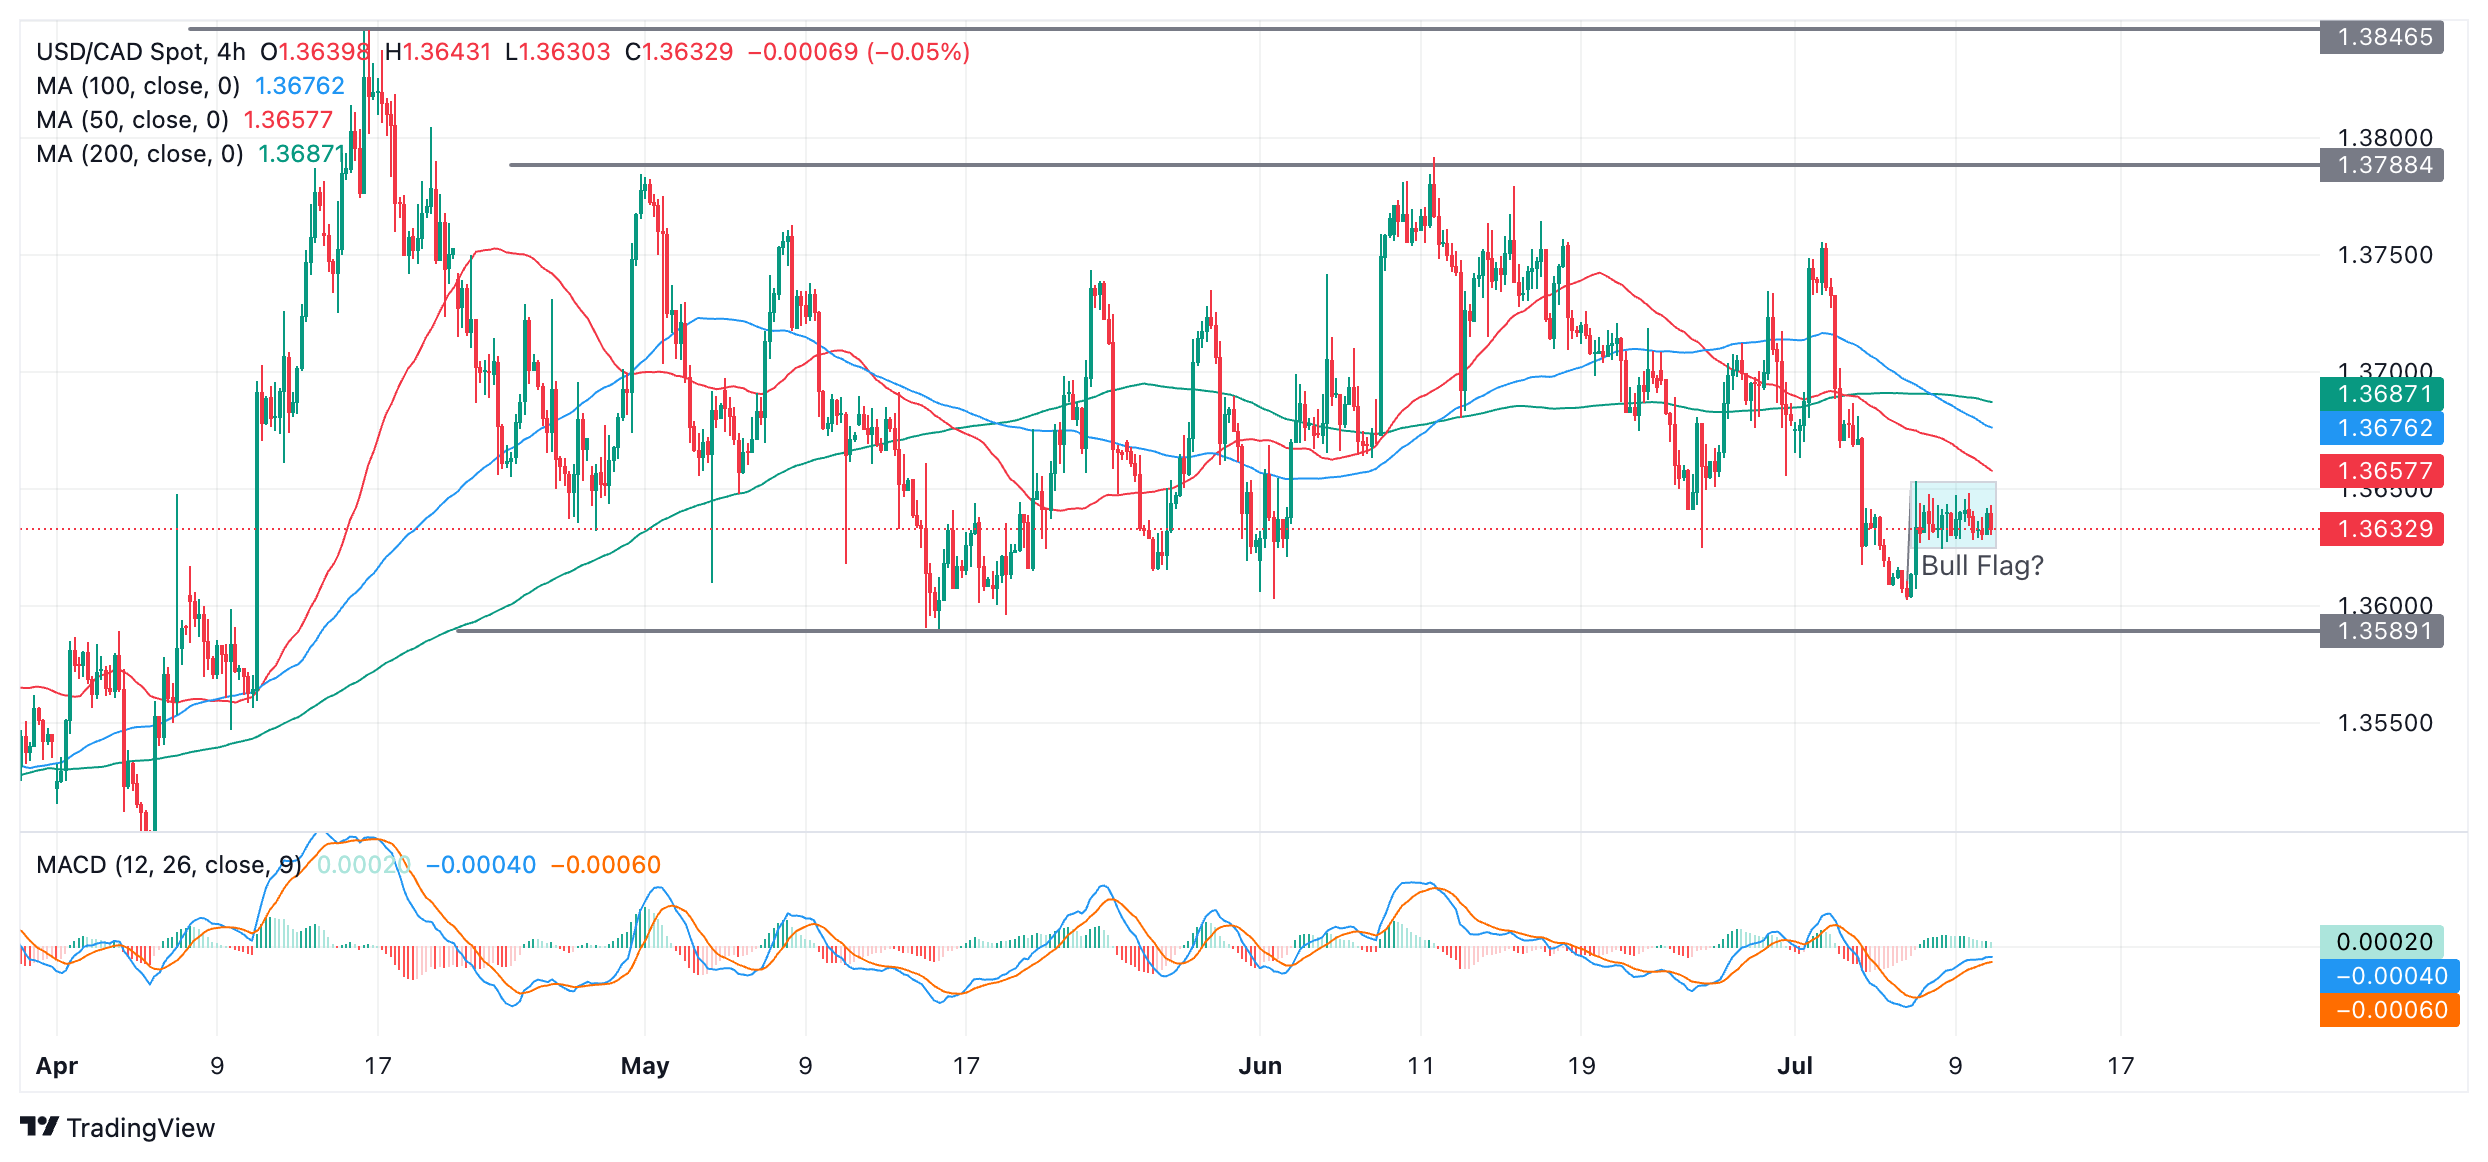
More recently, USD/CAD has found support near the bottom of the range at around 1.3589 and has bounced off. As it is in a sideways trend, it will likely start moving towards the top of the range, now at around 1.3788.
The MACD indicator crossed above its red signal line on July 5 after the initial bounce. This is a bullish signal and suggests that the next upside leg within the range is about to unfold. Note how in the past, crossovers of the MACD and the signal line coincided with price reversals within the range.
The USD/CAD has been trading in a mini sideways consolidation (light blue shaded area on the chart above) since July 5. This could be the “flag grid” of a small bullish pennant pattern. Such a pattern promises further upside if the price breaks the top of the rectangular consolidation phase. The target for upside continuation after the breakout is located at 1.3764, the length of the initial bounce or “flagpole” extrapolated upwards.
Source: Fx Street
I am Joshua Winder, a senior-level journalist and editor at World Stock Market. I specialize in covering news related to the stock market and economic trends. With more than 8 years of experience in this field, I have become an expert in financial reporting.


