
- The Canadian dollar is posting nice gains for the week of 0.85%.
- A positive market sentiment fueled appetite for high beta currencies such as the CAD.
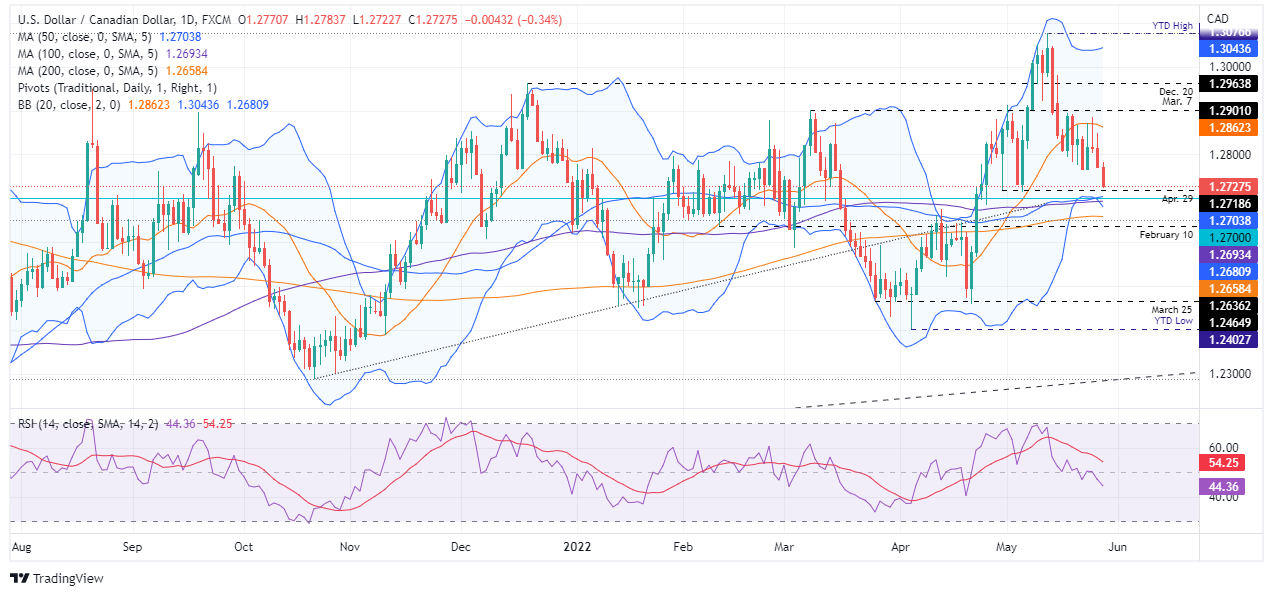
- USD/CAD Price Forecast: Facing strong support around 1.2694-1.2700.
The USD/CAD declined in the North American session, extending its weekly losses for the third week in a row, as investors shrugged off a “hawkish” US Federal Reserve as core PCE rose to 4.9%, but was down from 5.1% yoy . At the time of writing, the USD/CAD is trading at 1.2727.
US equities remain positive, reflecting a risk-on environment. The S&P 500 is about to trim its May losses as the US Commerce Department reported that inflation rose at a slower pace than in March. Will the Fed slow the pace of rate hikes after reaching the 2% threshold?
Although inflation is heading lower, ING analysts noted that there are some factors lurking in the economic environment. First, the geopolitical backdrop continues to push up energy prices. Second, China’s zero-covid policy held back the improvement of supply chains, and third, the tight labor market must mitigate a wage price spiral.
Elsewhere, USD/CAD started trading near daily highs at 1.2784 on Friday, but dipped towards fresh three-week lows around the 1.2720 area.
USD/CAD Price Forecast: Technical Outlook
USD/CAD continues to have a bullish bias, although its two-week downtrend will face strong support at the 50 and 100-day moving averages (DMAs), around the 1.2704-1 area, 2693. However, USD/CAD bulls should be careful not to get too confident that the mentioned level will hold. Why? The Relative Strength Index (RSI) at 44.29 is pointing lower, well into bearish territory, and with plenty of room before reaching oversold conditions.
If the USD/CAD two-week downtrend continues, the first major support would be the 1.2693-1.2704 area. A break below would expose the 200 DMA at 1.2658, followed by the April 22 low at 1.2566. On the other hand, the first resistance of the USD/CAD would be 1.2800. Once broken, the next supply zone would be the 20 DMA at 1.2862, followed by the March 8 high at 1.2901.
Technical levels
Source: Fx Street
With 6 years of experience, I bring to the table captivating and informative writing in the world news category. My expertise covers a range of industries, including tourism, technology, forex and stocks. From brief social media posts to in-depth articles, I am dedicated to creating compelling content for various platforms.


