
- Oil prices rise on concerns over tight supply, causing the CAD to soar against the USD.
- The Federal Reserve’s latest rate decision is expected to hold steady mid-week.
- On the economic calendar, there will be several high-impact data releases for both the USD and CAD this week.
He USD/CAD continues to lean lower, while the CAD is pushed higher by rising oil prices.
Oil prices continue to chew up chart paper, with US WTI (West Texas Intermediary) crude oil setting a new high of $91/bbl in Monday trading.
The USD/CAD pair is at five-week lows, while the dollar gives ground against the CAD, which is supported by raw materials, although in mid-week the Federal Reserve (Fed) will raise rates again. Markets generally expect the Federal Open Market Committee (FOMC) to keep interest rates at 5%.
Fed interest rate due midweek, US data to dominate market reactions
Oil prices will boost USD/CAD early in the week, but the economic calendar will give the dollar a big boost starting Wednesday. However, before this happens, the CAD will release the Canadian Consumer Price Index (CPI) figures on Tuesday.
The Canadian CPI will be released at 12:30 GMT on Tuesday, and is expected to rise to 3.8% from 3.3% previously, as the Bank of Canada (BOC) struggles to contain inflation, driven largely by the increase in energy prices.
U.S. initial jobless claims will be released on Thursday, which stood at 220,000, while Canadian retail sales for July will be released on Friday, which is forecast to rise from 0.1% to 0.4%.
The Purchasing Managers’ Index (PMI) for manufacturing and services in the United States will also be published on Friday. The manufacturing PMI is expected to decline slightly from 47.9 to 47.8, while the services component would decline from 50.5 to 50.3.
Technical Outlook for USD/CAD
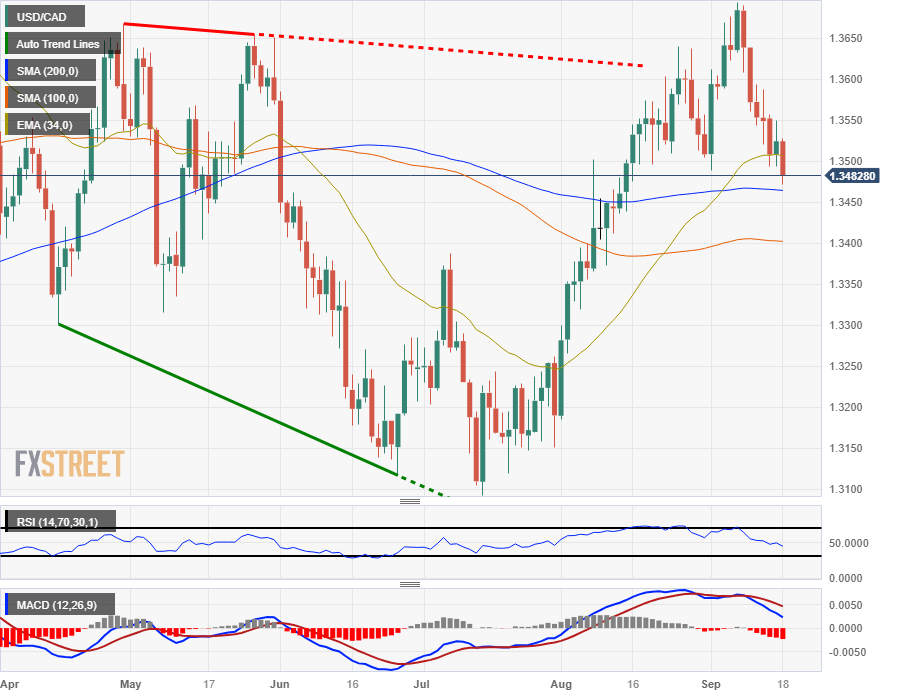
The USD/CAD pair is trading at the midpoint of the familiar territory initially reached in late 2022, and the pair is rapidly approaching the 200-day SMA near 1.3464, while prices slide further beyond the 34-day EMA, currently turning lower at 1.3505.
The Relative Strength Index (RSI) and Moving Average Convergence-Divergence (MACD) are firmly bearish on daily candles, and the indicators are warning buyers that there could still be plenty of room to run lower before a break can be made. mount a successful bullish offensive.
USD/CAD Daily Chart
USD/CAD Technical Levels
Source: Fx Street
I am Joshua Winder, a senior-level journalist and editor at World Stock Market. I specialize in covering news related to the stock market and economic trends. With more than 8 years of experience in this field, I have become an expert in financial reporting.


