
- USD/JPY trades at a loss ending five days of gains amid falling dollar and risk aversion.
- A daily close below 138.17 could send the pair lower, with 138.00 as main support.
- USD/JPY needs to recapture the 138.00 level to regain bullish momentum, with resistances at 138.17 and 139.00.
The USD/JPY pair forms a bearish candlestick pattern, breaking five days of gains, down nearly 0.60%, after hitting a weekly high of 138.74. Risk aversion and dollar weakness weighed on the USD/JPY pair. At the time of writing, the USD/JPY pair is trading at 137.90, below its opening price.
USD/JPY Price Analysis: Technical Perspective
The USD/JPY pair maintains a bullish bias, but a bearish candlestick formation could open the door for further losses. The Relative Strength Index (RSI) remains in bullish territory but is pointing lower, which could halt USD/JPY’s slide. However, if USD/JPY achieves a daily close below the Dec 15 daily low at 138.17, this would put bearish pressure on the pair.
In that case, the first support for USD/JPY would be 138.00. A break of this latter level would expose the May 18 daily low at 137.28, followed by the May 17 swing low at 136.30.
USD/JPY must reclaim the 138.00 figure for a bullish resumption. Once this is done, the next resistance would be the December 15 high at 138.17, followed by the 139.00 figure. A rally above the latter would expose USD/JPY to the upside. A recovery above the latter would expose the November 30 high at 139.89, before challenging the 140.00 figure.
USD/JPY Price Action – Daily Chart
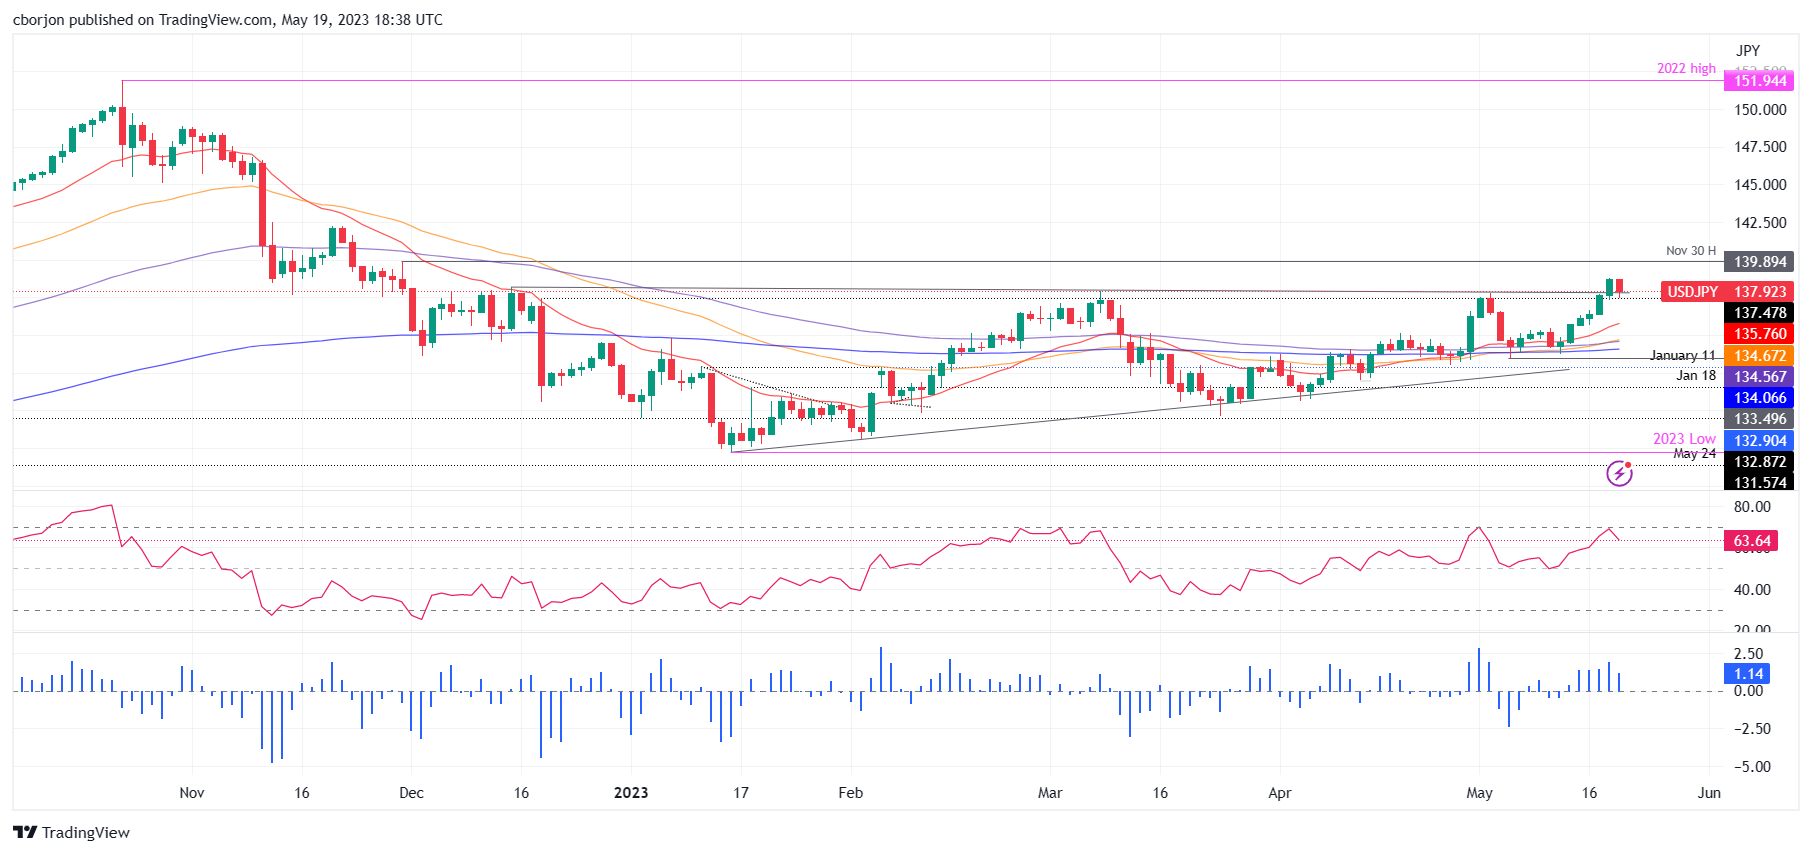
Source: Fx Street
I am Joshua Winder, a senior-level journalist and editor at World Stock Market. I specialize in covering news related to the stock market and economic trends. With more than 8 years of experience in this field, I have become an expert in financial reporting.


