
- The USD/JPY ‘shooting star’ candle suggests a possible bearish continuation despite the current momentum from buyers.
- Key Supports: September 19 low at 141.88, 140.44 and yearly low at 139.58.
- Buyers need to overcome the resistance at 143.94, with the next target at the Kijun-Sen at 144.48 for upside control.
USD/JPY held on to gains following Wednesday’s Federal Reserve decision but traded well below its daily peak of 143.94 as the Dollar posted losses.
On the data front, the US initial jobless claims report for the latest week came in better than expected but failed to boost the dollar. Meanwhile, traders await the release of Japanese inflation data and the Bank of Japan’s monetary policy decision.
USD/JPY Price Forecast: Technical Outlook
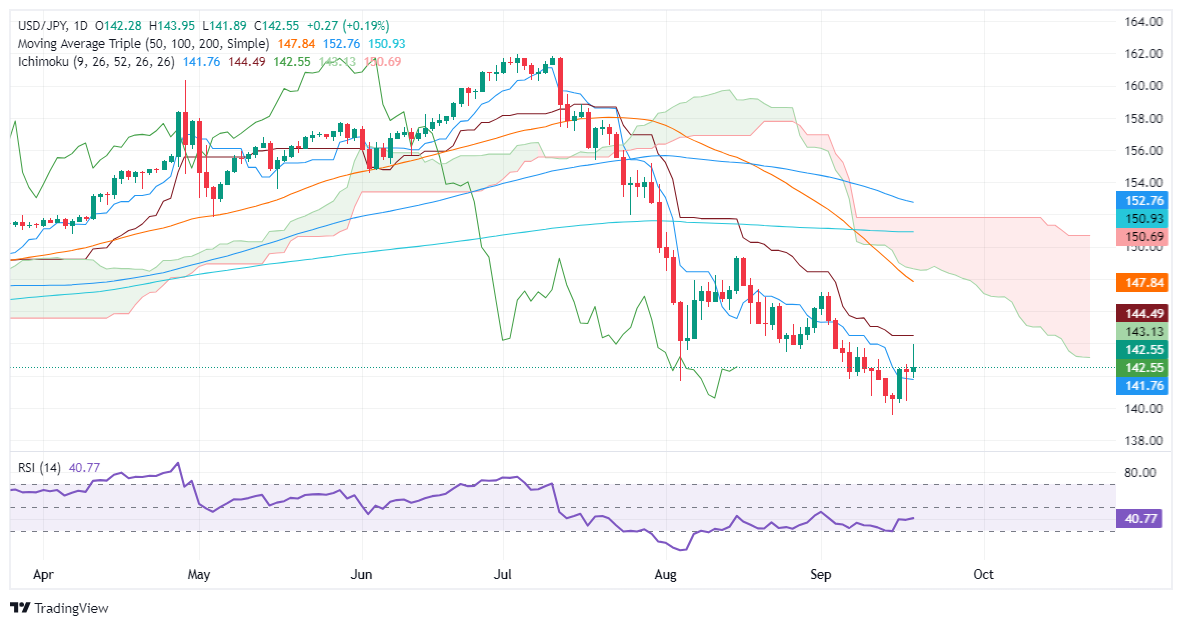
The downtrend is set to continue despite regaining some ground. At the end of Thursday’s session, the USD/JPY pulled back from the weekly high, forming a ‘shooting star’ candle. This means that bears are entering the market, paving the way for a retest of the yearly low of 139.58.
In the short term, momentum favors buyers as shown by the Relative Strength Index (RSI), although in the long term, the RSI is bearish.
For a bearish continuation, USD/JPY must clear the September 19 low of 141.88, followed immediately by the Tenkan-Sen at 141.76. Once those levels are cleared, the next demand zone would be the September 18 daily low of 140.44, followed by the yearly low of 139.58.
On the other hand, buyers need to overcome the September 19 high of 143.94 before testing the Kijun-Sen at 144.48.
USD/JPY Price Action – Daily Chart
Japanese Yen PRICE Today
The table below shows the Japanese Yen (JPY) exchange rate against major currencies today. Japanese Yen was the strongest currency against the Japanese Yen.
| USD | EUR | GBP | JPY | CAD | AUD | NZD | CHF | |
|---|---|---|---|---|---|---|---|---|
| USD | -0.40% | -0.51% | 0.20% | -0.34% | -0.71% | -0.53% | 0.10% | |
| EUR | 0.40% | -0.11% | 0.62% | 0.07% | -0.29% | -0.12% | 0.51% | |
| GBP | 0.51% | 0.11% | 0.72% | 0.17% | -0.20% | -0.01% | 0.60% | |
| JPY | -0.20% | -0.62% | -0.72% | -0.51% | -0.90% | -0.74% | -0.11% | |
| CAD | 0.34% | -0.07% | -0.17% | 0.51% | -0.37% | -0.19% | 0.43% | |
| AUD | 0.71% | 0.29% | 0.20% | 0.90% | 0.37% | 0.18% | 0.80% | |
| NZD | 0.53% | 0.12% | 0.01% | 0.74% | 0.19% | -0.18% | 0.63% | |
| CHF | -0.10% | -0.51% | -0.60% | 0.11% | -0.43% | -0.80% | -0.63% |
The heatmap shows percentage changes of major currencies. The base currency is selected from the left column, while the quote currency is selected from the top row. For example, if you choose the Japanese Yen from the left column and move along the horizontal line to the US Dollar, the percentage change shown in the chart will represent the JPY (base)/USD (quote).
Source: Fx Street
I am Joshua Winder, a senior-level journalist and editor at World Stock Market. I specialize in covering news related to the stock market and economic trends. With more than 8 years of experience in this field, I have become an expert in financial reporting.


