
- The Mexican peso loses momentum against the dollar after hitting multi-year highs.
- Dollar gains momentum as Wall Street pares gains.
- Inflation decreases modestly in Mexico, Banxico’s Minutes point to a lower rate hike.
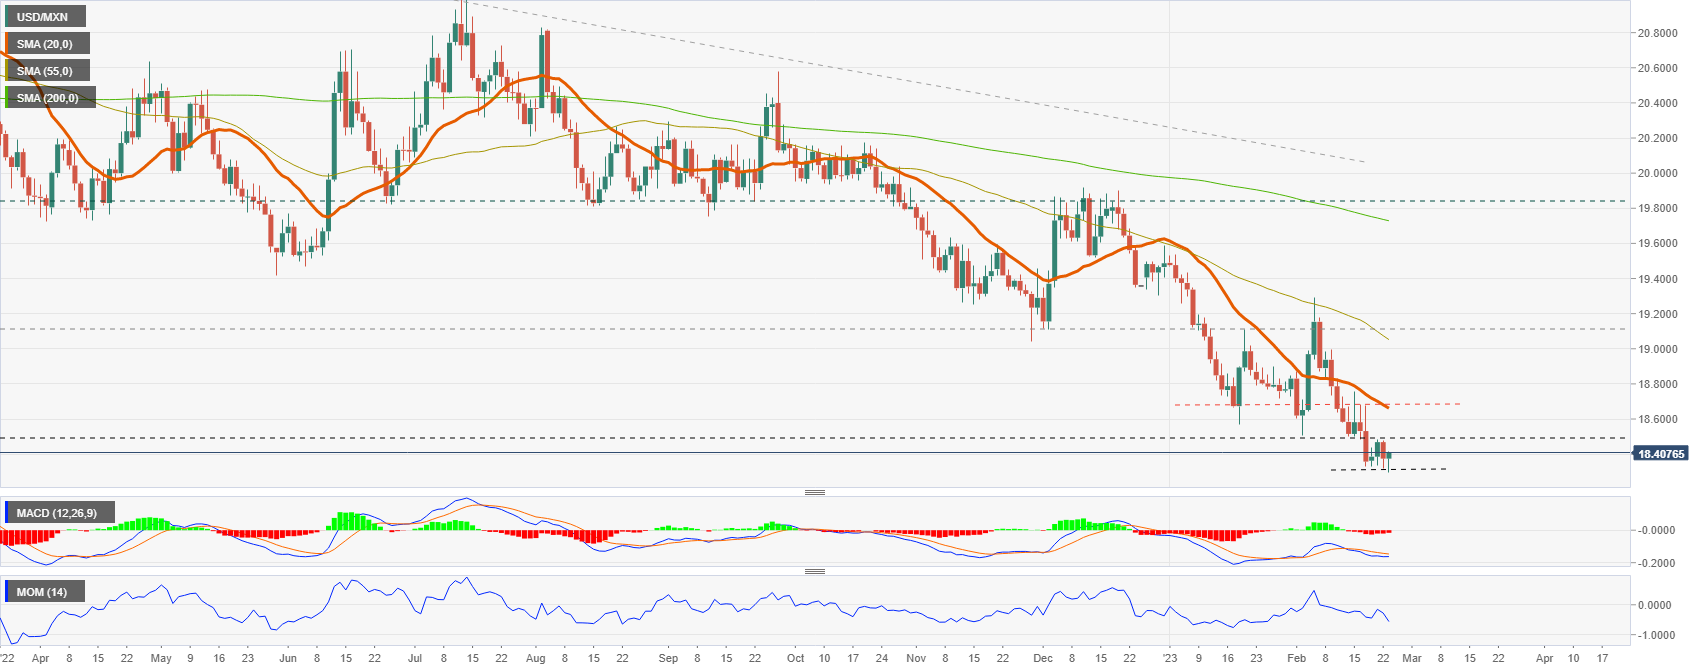
The pair USD/MXN reaches daily highs at 18.42, with a daily advance. It previously bottomed at 18.30, the lowest level since April 2018. The rebound took place amid a stronger US dollar across the board and a bearish reversal in US stock markets.
The dollar strengthened following US economic data that included a fresh revision to fourth-quarter GDP, a decline in jobless claims and a rebound in the Chicago activity index.
USD/MXN is bouncing after testing levels below 18.30. The mentioned level is critical and a consolidation below it would point to further weakness. If the current correction extends, it would face resistance at the 18.50 area. A recovery above would add support for an extension towards 18.68.
Inflation slows down slowly in Mexico, Banxico down
Banco de México published the minutes of its last meeting of the Board of Directors held on February 9. They surprised the market with a 50 basis point rate hike, versus expectations for a 25 basis point hike. The minutes showed that council members considered rate hikes could be more moderate at the next meeting, scheduled for March 30.
The end of the rate hike cycle seems close, but inflation is still far from the 3% target set by Banxico. Data released Thursday showed that inflation slowed more than expected during the first half of February. The annual rate fell from 7.94% to 7.76%, while the underlying index reached 8.38%.
USD/MXN daily chart
Source: Fx Street
I am Joshua Winder, a senior-level journalist and editor at World Stock Market. I specialize in covering news related to the stock market and economic trends. With more than 8 years of experience in this field, I have become an expert in financial reporting.


