
- The US dollar slumped 2.5% on Friday and hit a six-week low at 1.3470.
- A mixed NFP report sends the dollar lower.
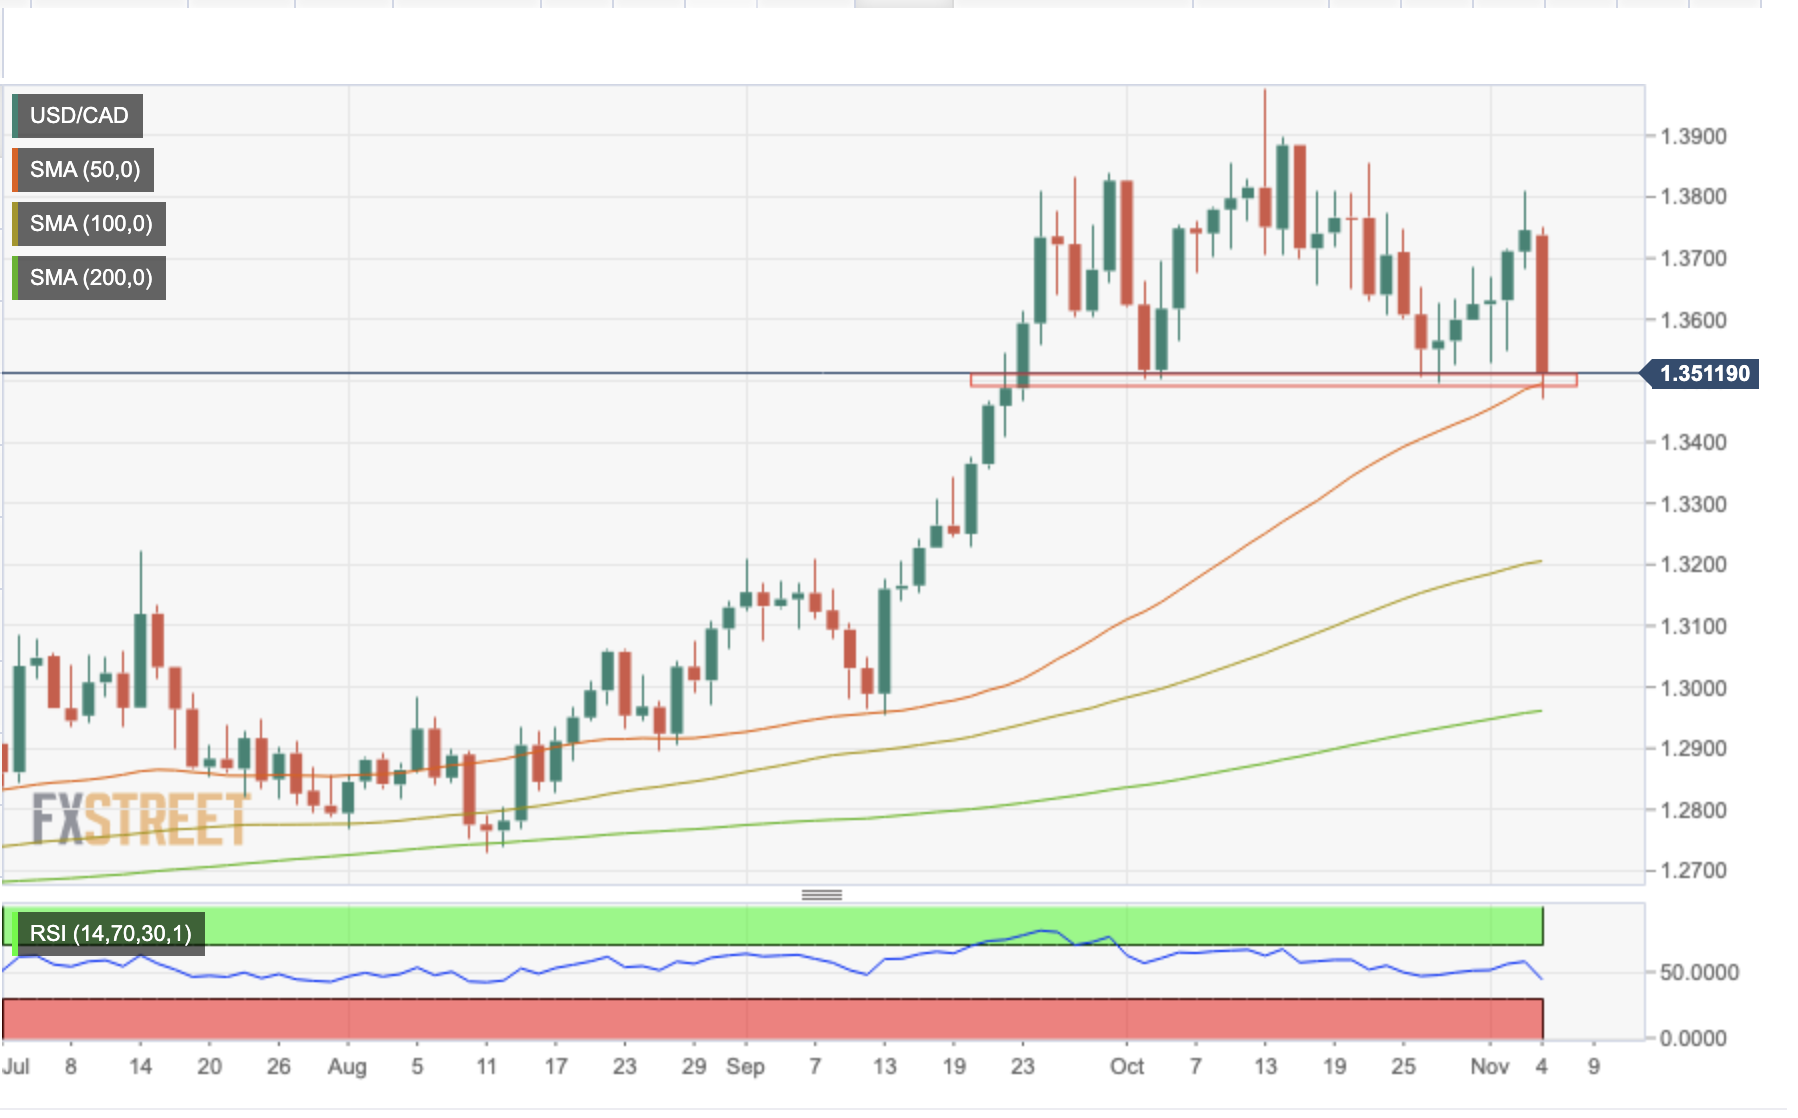
- USDCAD is testing the neckline of a possible H&S formation.
The US dollar is about to close its worst daily performance in a few months with a sell-off of almost 1.8%. USDCAD has extended its reversal from Thursday’s high of 1.3800 to levels below 1.3500 for the first time since late September.
A mixed employment report has hit the US dollar
The US Non-Farm Payrolls report has shown an increase of 261,000 in October, beating expectations of 200,000, and September figures have been revised up to 315,000, from 4,000 previously estimated.
The unemployment rate, however, has risen to 3.7% from 3.5% in September, above the 3.6% consensus, while hourly earnings rose to 4.7% in October from 5% in September. These figures suggest that labor market conditions may be softening, which has dampened expectations of further aggressive rate hikes by the Fed.
The US dollar, which had been rising since Wednesday after US Fed Chairman Jeremy Powell reiterated the need for further monetary tightening, fell like a stone on Friday on the first signs that the Fed’s monetary policy could be starting to have an effect.
USDCAD is testing support at 1.3500
The daily chart shows the pair reaching the area where the neckline of a head and shoulders pattern formation meets the 50-day SMA at 1.3500.
A clear break of that area would trigger the H&S pattern, and could push the pair towards 1.3200 (1st and 7th Sep highs and 100-day SMA) and then probably the psychological level of 1.3000.
USDCAD daily chart
Technical levels to watch
Source: Fx Street
With 6 years of experience, I bring to the table captivating and informative writing in the world news category. My expertise covers a range of industries, including tourism, technology, forex and stocks. From brief social media posts to in-depth articles, I am dedicated to creating compelling content for various platforms.


